
1. Introduction
Fire detectors are important automatic fire detection devices used in our daily lives. In particular, smoke detectors have become the most popular detectors owing to their high sensitivity and simple operation principle, which involves optical methods. The Underwriters Laboratories (UL) is currently introducing the UL-217 and UL-268 standards for all fire detectors. As such, studies are being conducted to satisfy the new standards. T.G. Cleary [1] at the NIST analyzed the performance of current smoke detectors based on new fire sources and non-fire alarm sources; subsequently, he proposed a few design changes.
Research pertaining to the use of optics to analyze smoke particles primarily involve studies that analyze particle distributions using the reaction properties of smoke particles such as extinction, scattering, and transmission. M. Cole [2] analyzed the difference in reactivity between two wavelengths and suggested that the presence of fire can be determined by evaluating fire sources and non-fire alarms based on a particle size of 1 ┬Ąm. S. Yan et al. [3] used the correlation coefficient between IR and blue dual wavelengths to investigate an optimal set, and T. Deng et al. [4] distinguished particle sizes using dual wavelengths to estimate surface area concentrations. A. Chen et al. [5] reduced non-fire alarms using data from four optical channels, including the scattering angle. In summary, the size of smoke particles can be determined theoretically by the reactivity exhibited on different wavelengths in limited conditions. Additionally, this reactivity can be used to classify smoke particles.
This paper focuses on smoke detectors used in actual environments. In actual smoke detectors, a cost-effective combination of LEDs and photodiodes is preferred, unlike smoke detectors used in previous studies. Furthermore, a few practical difficulties are encountered when using straight laser diodes and structures that can measure various scattering efficiencies. As such, particles must be classified based on their scattering intensity tendencies in actual smoke, even though the measurement accuracy is limited. Furthermore, owing to the properties of smoke detectors, which necessitate continuous monitoring, the use of instantaneous data to define the properties of smoke particles is limited. The types of smoke that will occur in actual environments cannot be defined in advance; therefore, the time point from which a valid data ratio value is indicated in unstable data or the interval data that correspond to abnormal data cannot be determined. As such, an algorithm that can analyze data change trends and extract valid data intervals in real time must be developed.
This paper comprises five sections. Section 2 presents a simple simulation of scattering and the elements investigated in this study. Section 3 provides the algorithm for extracting valid intervals from actual scattering signals. Section 4 presents a description of the experiment environment and data acquisition equipment for verifying the algorithm, as well as the experimental results. The conclusions are presented in Section 5.
2. Background
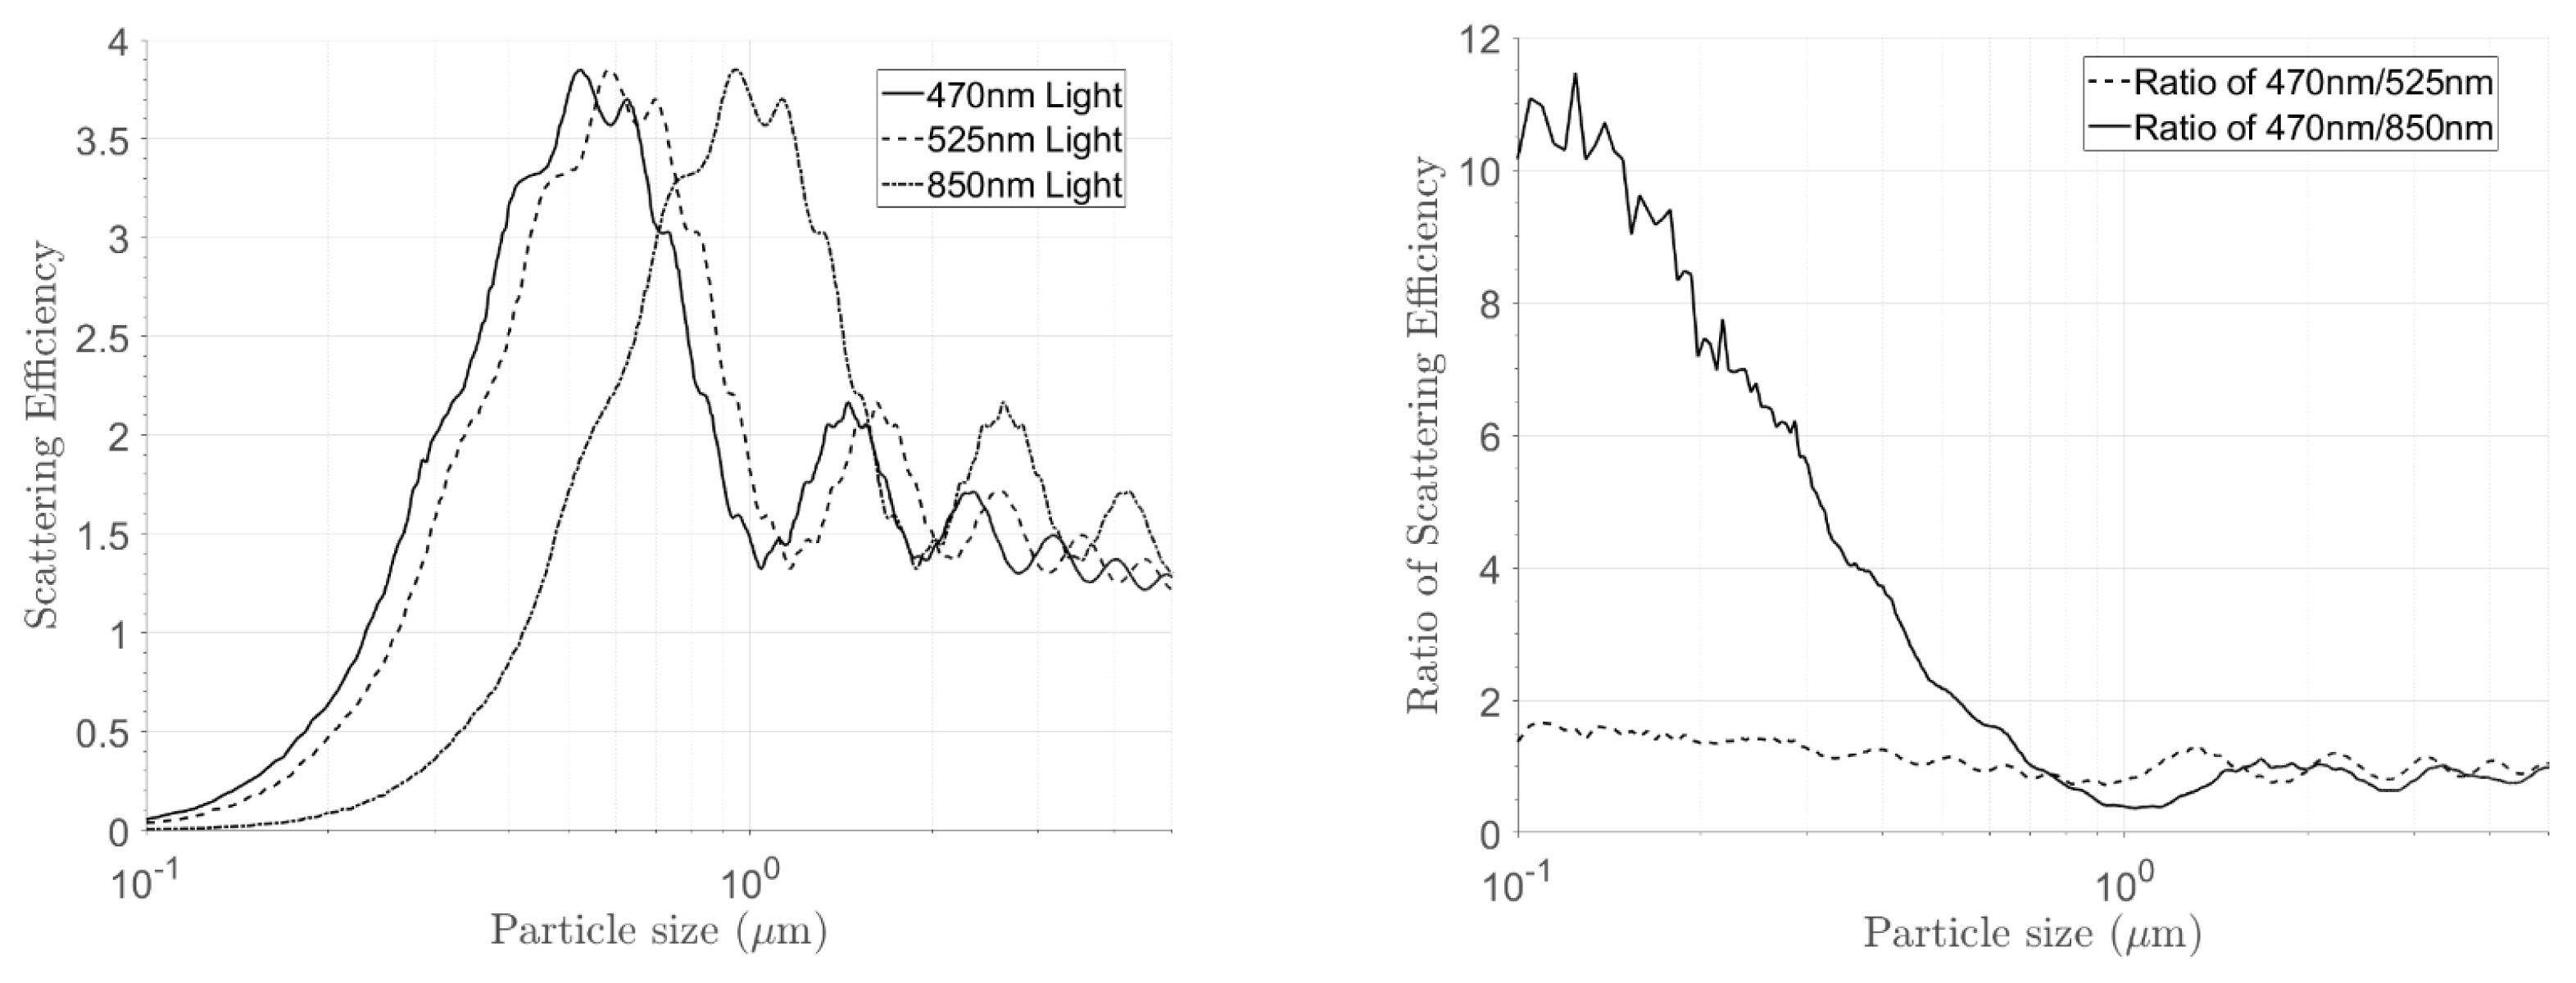
The absorption and scattering of light due to particles can be analyzed based on the particle size using various models. According to Mie's scattering theory, the scattering intensity due to particle size is related to the intensity and wavelength of the light source, the refractive index of the particles, and the scattering angle [6]. To obtain the ratio of the particle size to the scattering efficiency for light sources of various wavelenghts, MATLAB simulations of Mie scattering and absorption were performed based on a previous study [7]. Parameters were defined for three wavelengths (i.e., 470, 525, and 850 nm), and the total scattering efficiency was calculated based on the refractive index (m = 1.55 + 0.02i) and the lognormal distribution of particle sizes of white smoke presented in [8].
Figure 1(a) shows a graph of the total scattering efficiency vs. the particle size at each wavelength. The X and Y-axes represent the particle size and scattering efficiency Qsca, respectively. Based on a previous study [2], non-fire alarm sources (water vapor, dust, etc.) typically include particles measuring 1 ┬Ąm or greater, and actual fire sources generate particles measuring 1 ┬Ąm or less. In an ideal scenario, actual fire sources exhibit a higher total scattering efficiency for light sources on the low-wavelength bands, whereas non-fire alarm sources exhibit irregular scattering efficiencies. Figure 1(b) shows a graph of the scattering ratio vs. the particle size for light sources of two different wavelengths. The 470 and 525 nm wavelengths exhibited a stable ratio for the particle sizes in light sources with adjacent wavelengths. Meanwhile, the 470 and 850 nm wavelengths exhibited a high ratio for particle sizes of 1 ┬Ąm or less and a low ratio for particle sizes of 1 ┬Ąm or more. The simulation results show that the ratio of scattering efficiency at two wavelengths can be used to distinguish particles generated by fire sources. However, in an environment where actual smoke particles are flowing into a detector, the scattering efficiency is expected to change because of changes in the nonuniform particle distributions and particle concentrations over time. Consequently, the scattering efficiency ratio will not remain constant, and valid scattering efficiency ratios cannot be determined. Hence, an algorithm that can extract valid intervals from unstable data is necessary.
3. Algorithm
The algorithm used in this study defines light sources that emit light at three wavelengths and photodiodes that detect light at these wavelengths. The intensity of the light detected by the photodiodes can be converted to a discrete signal and used as data. In [9], the ratio of the power of light sources generated by LEDs at each wavelength to the power detected by the photodiodes after particle scattering is defined as the power transfer ratio (PTR). Herein, it is represented as PTR470, PTR525, and PTR850 for the 470, 525, and 850 nm wavelengths, respectively, and each PTRx is calculated as follows:
, where PPD and PLEDx are the power of the light source and photodiode, respectively; IPD is the photodiode's electrical current; ILEDxPK is the maximum current of the LED at the corresponding wavelength; RPD is the photodiode's reactivity; ╬ĘLED is the LED's efficiency [10].
Let mx denotes the sample mean, and Žāx denotes the standard deviation of length n of the discrete signals during the normal state before smoke particles are generated. Ci+, which represents the one-sided upper CUSUM of the tabular CUSUM, is defined as follows [11]:
, where i is the data at the i-th sample instant as the data are generated in real time. K is a reference value defined as K = ╬┤Žā/2 herein. The variable ╬┤ represents the number of standard deviations for detection including noise. For reference, the PTR signal (Eq. (1)) always increases as particles flow in when only ideal scattering is considered. Therefore, the index kmin, which is obtained when the PTR signal begins to increase as particles are generated based on Eq. (2), can be defined as follows:
, where c is the control limit of CUSUM.
Note that the total scattering intensity decreases as the wavelength increases in the case of fire sources. Also note that the ratio of the 470 nm PTR to the 525 nm PTR has a less variation compared with that of the 470 nm PTR to the 850 nm PTR. Let R(i) and RŌĆ▓(i) denotes the ratios for the wavelengths, respectively, they are expressed as follows:
To extract a valid interval from an unstable scattering intensity ratio, the moving variance Vi for the sliding window of adjacent elements at the i sample instant can be calculated as follows:
, where N is the length of the sliding window, which satisfies N = a + b; ╬╝i is the moving average of the window at the i sample instant. S is the index vector of the valid interval in the data after the kmin defined in Eq. (3), and it is defined as follows:
, where ╬▒ is the minimum variance for defining the valid interval's index.
Therefore, the sample mean filter of the scattering intensity ratio of the valid interval in the i sample is expressed as follows:
, where NŌĆ▓ is the length of S.
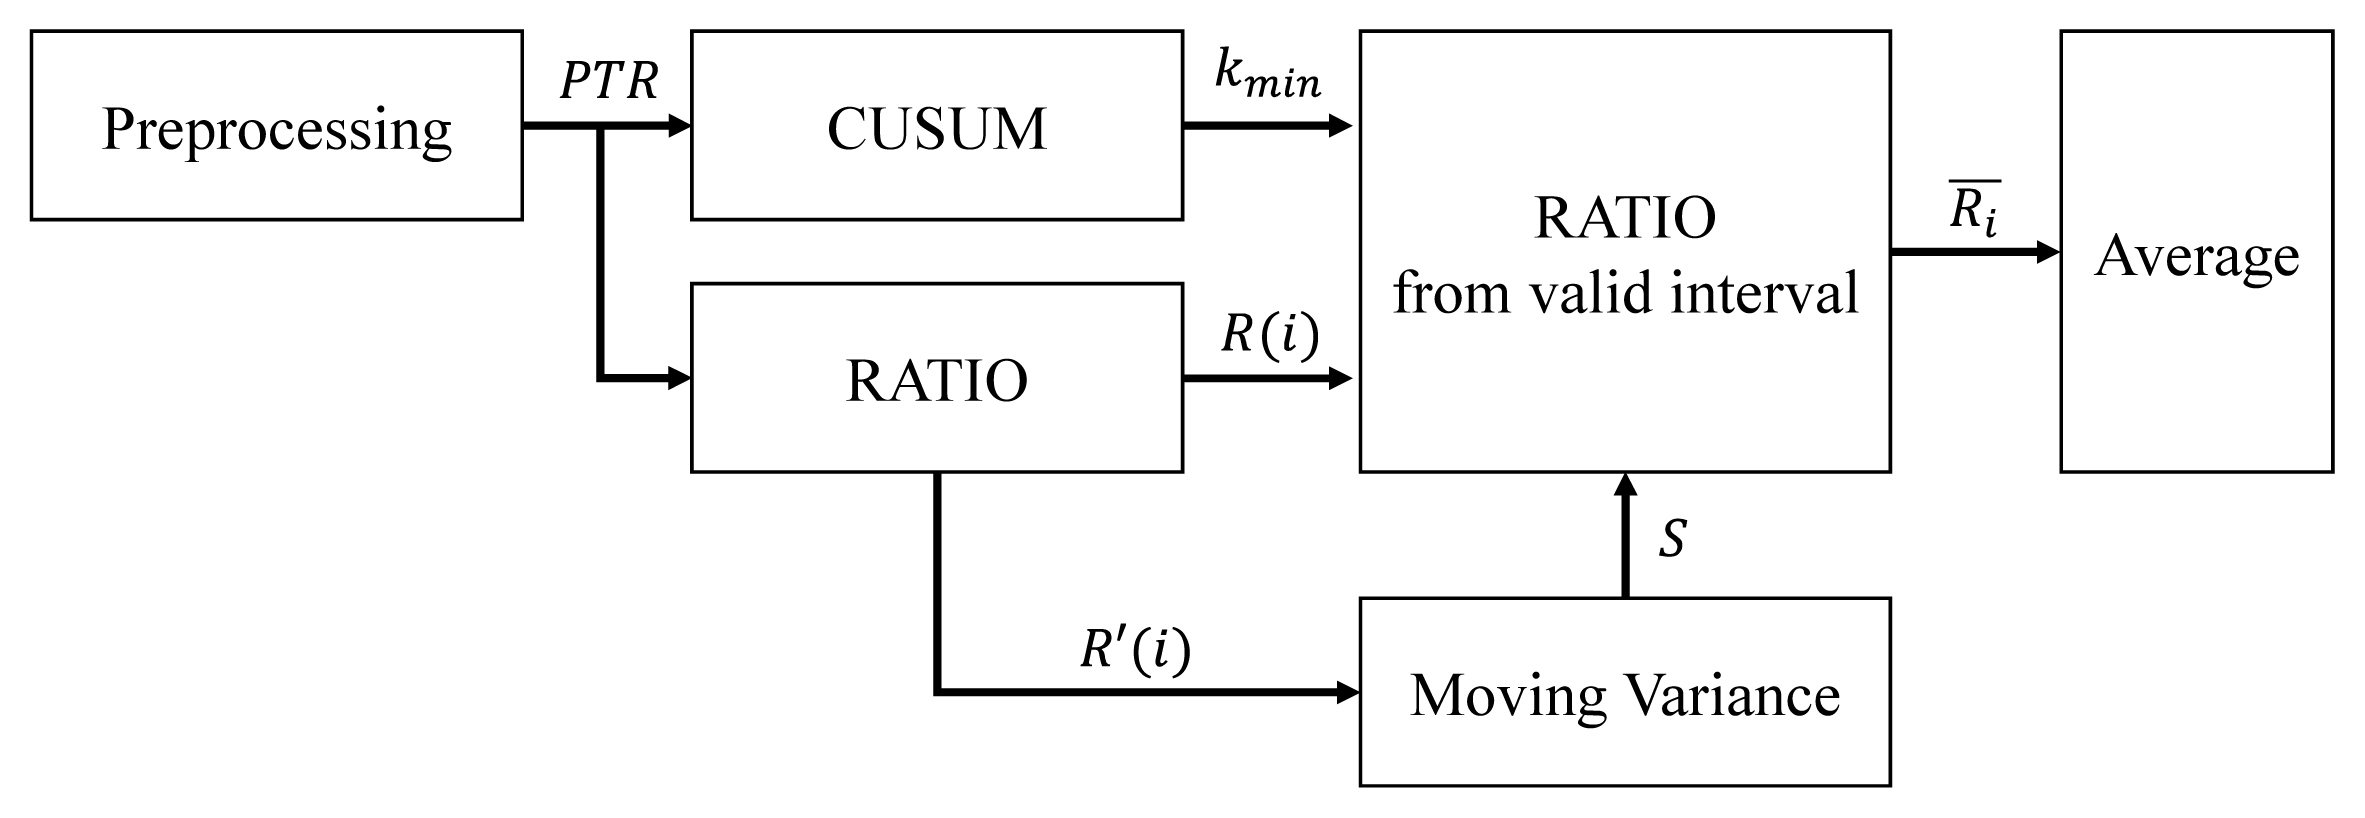
Figure 2 shows a flowchart of the algorithm for obtaining the scattering intensity ratio based on the wavelength. The discrete signal data detected by the photodiode is preprocessed to obtain the PTR. kmin is observed based on the tabular CUSUM in Eq. (2), and the scattering intensity ratio is calculated based on the wavelength. The properties of the smoke particles are extracted by calculating the sample mean R ¯ i
4. Experimental Measurement
4.1 Design of sensing device
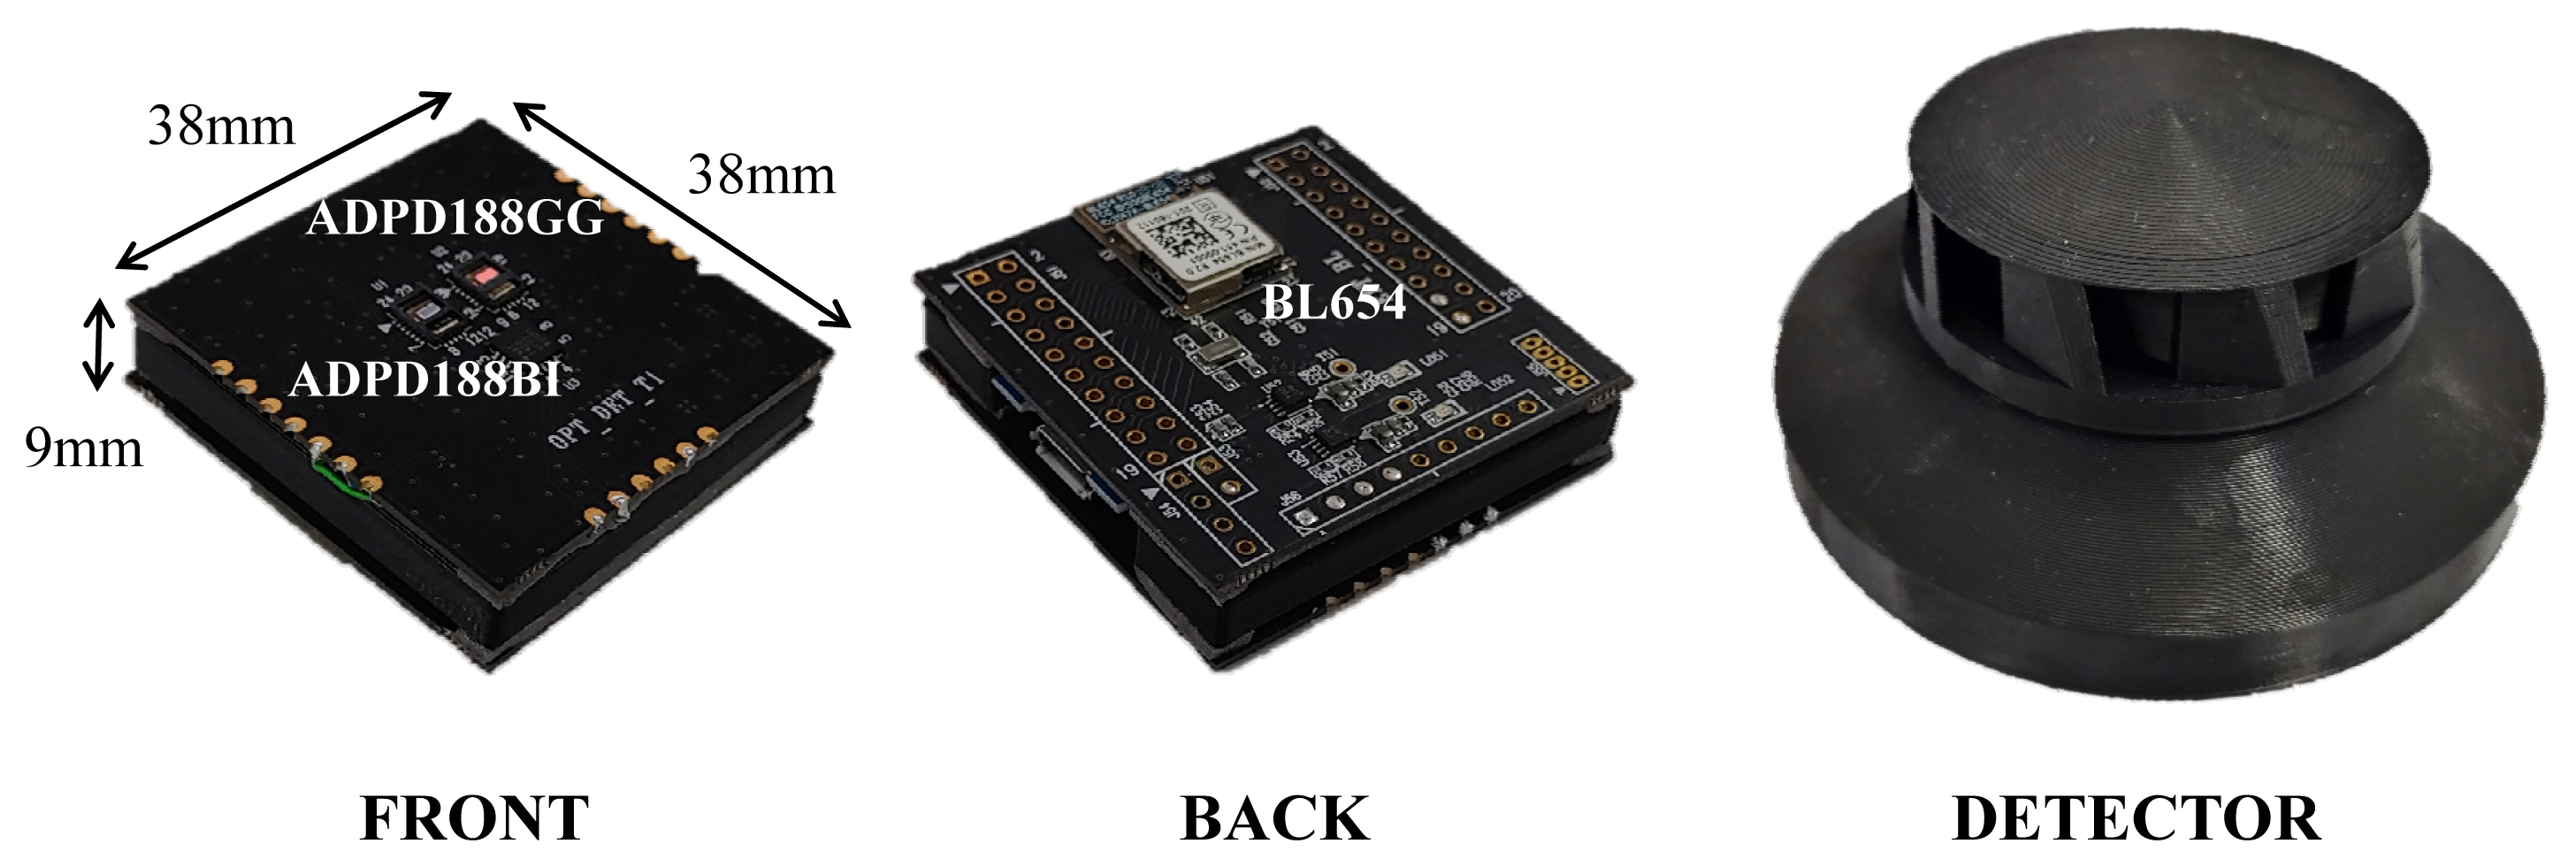
The following device was fabricated to perform experiments on smoke from fire sources and non-fire alarm sources. To obtain data based on the three wavelengths, the device was incorporated with two sensors: the ADPD188BI [10] and ADPD188GG [12] by Analog Devices. The ADPD188BI detects light scattered by particles on two wavelengths(470 and 850 nm), and the ADPD188GG detects scattered light on the 525 nm wavelength. The ADPD188GG was developed to measure biosignals. However, in this study, data were acquired by performing suitable preprocessing in advance to verify the usefulness of each wavelength band. The device was configured as shown in Figure 3, and a package similar to a smoke detector was fabricated to allow smoke to flow through the device; this package was installed in the experiment chamber. A sensor board measuring 38 mm (H) ├Ś 38 mm (W) ├Ś 9 mm (D) was fabricated, and each sensor was placed 6.4 mm from the center to allow the signal, which was scattered by the inflowing smoke, to be obtained.
The device was designed to allow data to be obtained from the main processer through 12C communication with each sensor. A BL654 module by Laird Connectivity [13] was used to perform data acquisition and transmit data to the data server via BLE wireless communication. The sampling rate and the pulse count of one slot can be defined using the ADPD188BI's settings register. The settings register for the ADPD188GG can be established similarly; however, it is controlled by the main processor such that the two sensor are operated independently. The DATA_RDY interrupt was used to operate the ADPD188BI, and scattering intensity data were obtained for the 470 and 850 nm wavelengths. Subsequently, the ADPD188GG's operational state was switched by changing its internal register, and scattering intensity data for the 525 nm wavelength were obtained. Finally, this structure was designed to operate at a 7 Hz sampling rate, including data acquisition, processing, and output.
4.2 Experimental equipment
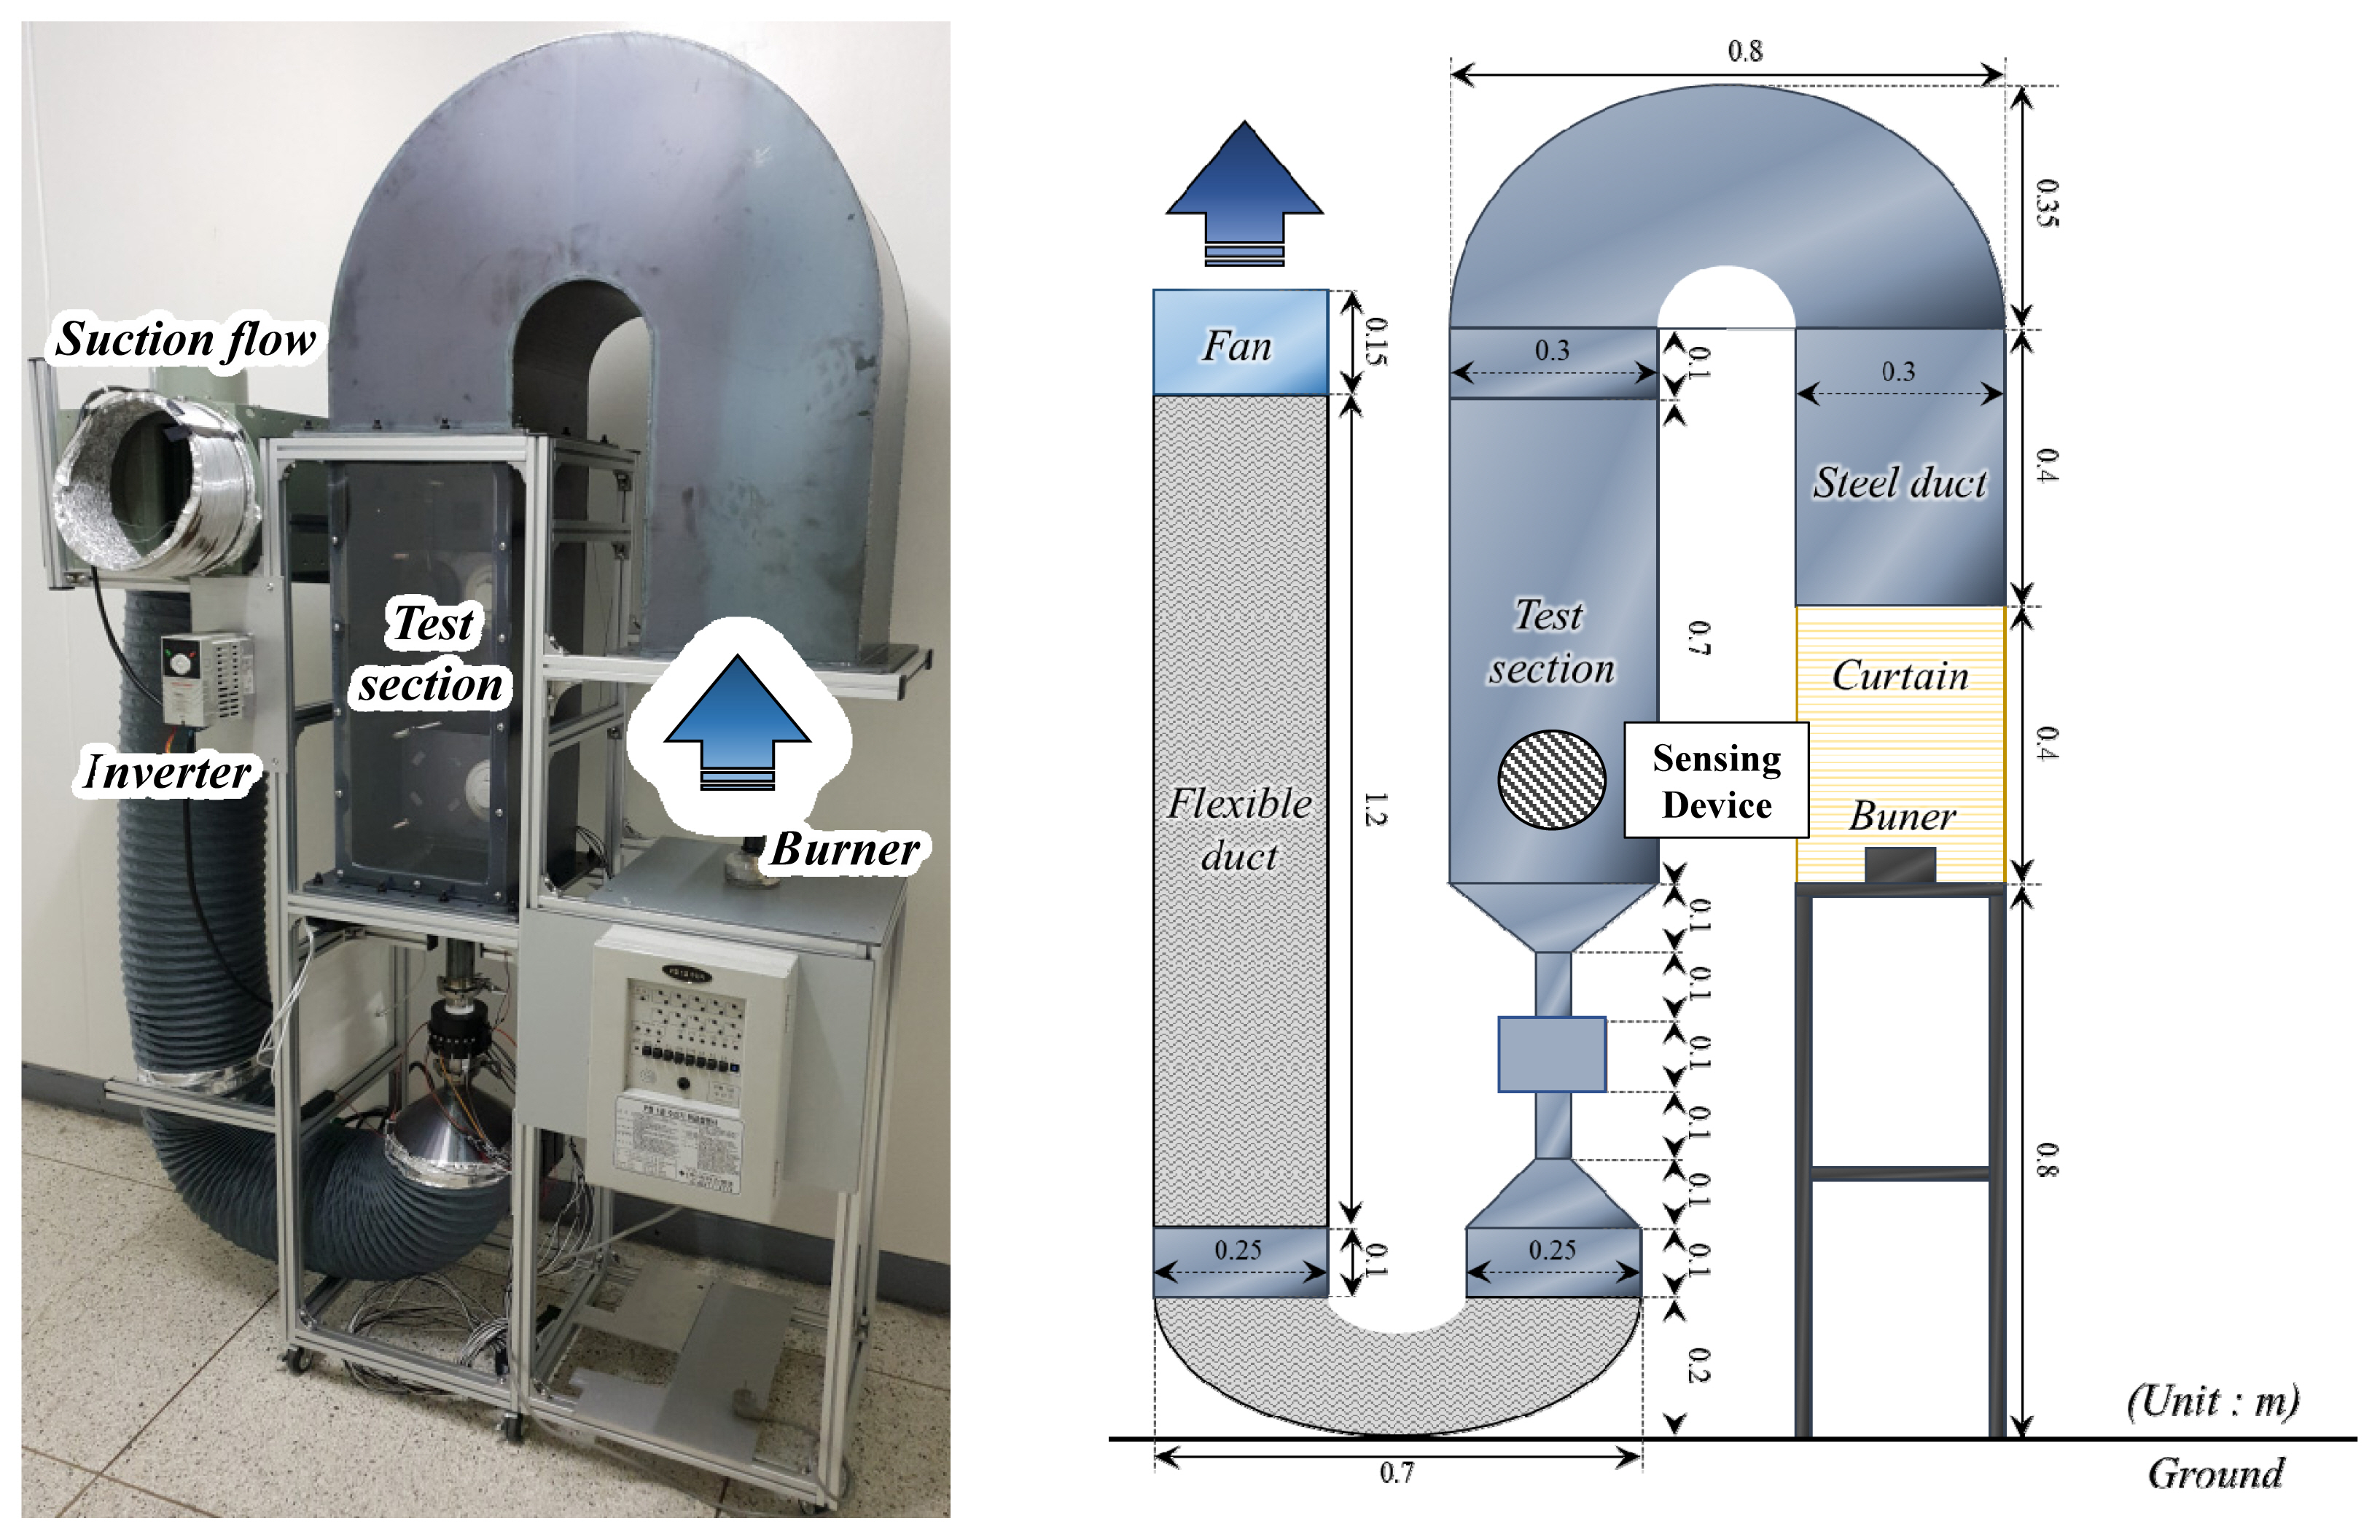
Figure 4 shows a photograph and an illustration of the experiment chamber for generating smoke particle data. The experiment chamber includes a carbon-steel square duct with a cross-section of 0.09 m2 (0.3 m ├Ś 0.3 m). The material for the fire experiments was placed on the burner and burned, and a fan was placed at the end of the smoke's path to create a uniform flow. The generated particles entered the initial duct and then the test section. The aforementioned data acquisition device was placed in the test section in the particle flow direction. Five types of fire sources and non-fire alarm sources were selected to generate the smoke particles. As shown in Table 1, paper, kerosene, and polyurethane were selected as the fire sources, and vapor and frozen meat were selected as the non-fire alarm sources. The experiments were performed 10 times for each fire source and non-fire alarm source, and the same specimens were used for each smoke particle generation experiment. To generate particles TF01-TF10, filter paper by ADVANTEC was used. Meanwhile, for particles TF11-TF20, kerosene liquid was used to generate smoke with a wick. To generate particles TF21-TF30, polyurethane polymer pellets were used. For particles TF31-TF40, an ultrasonic humidifier was used to generate vapor. Meanwhile, particles TF41-TF50 were generated by cooking frozen meat in a heated frying pan.
4.3 Results
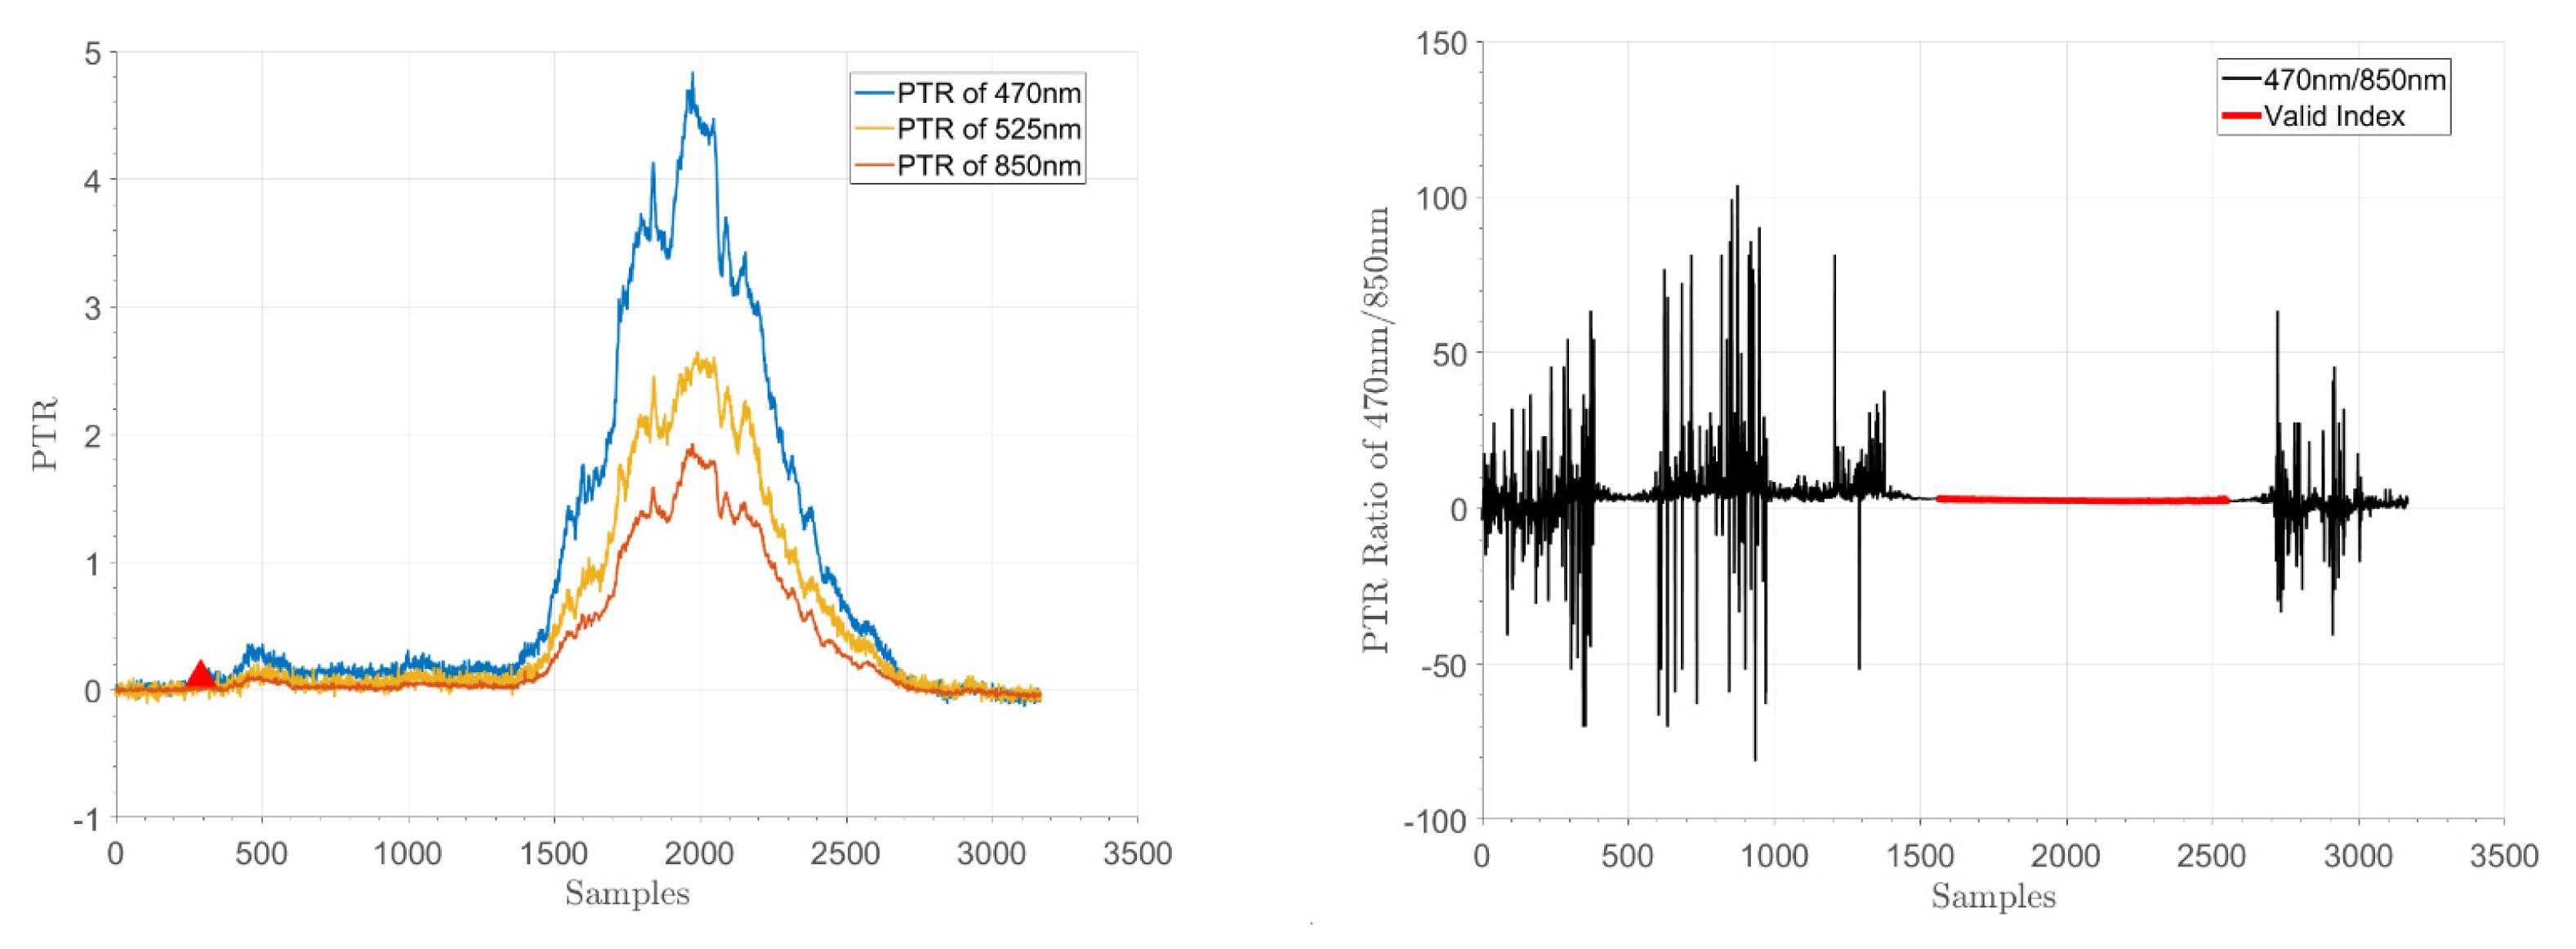
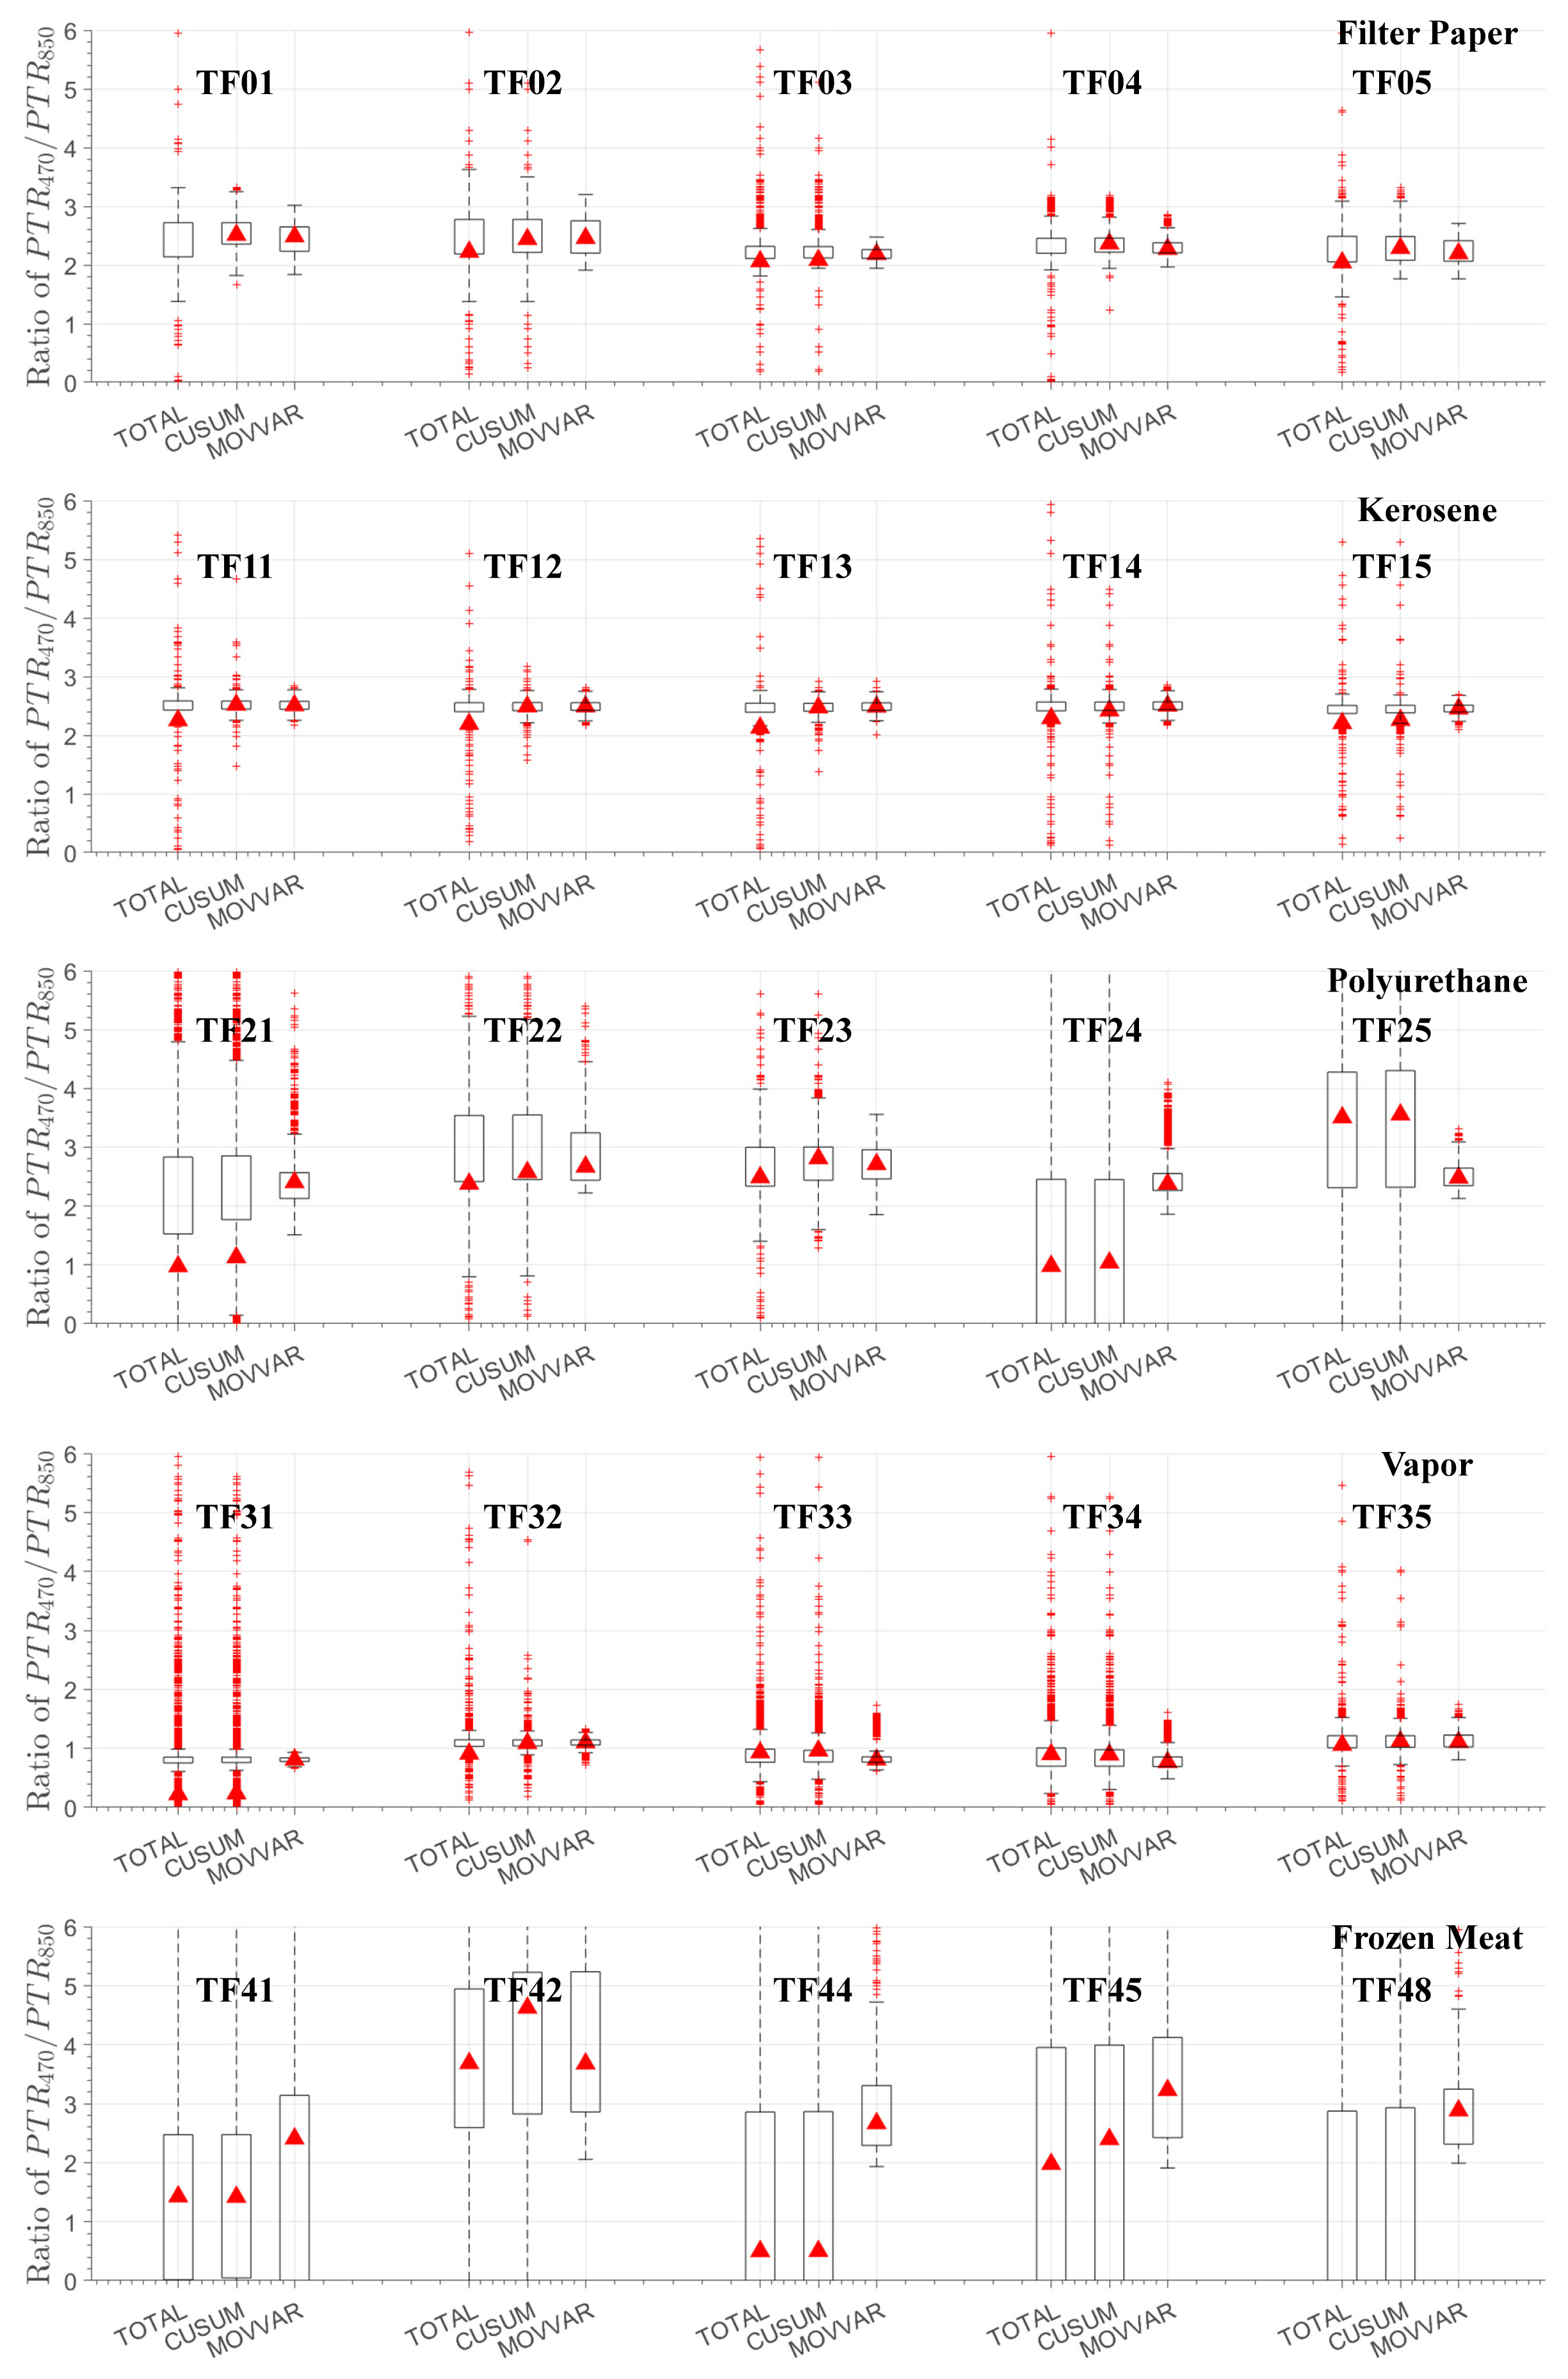
Figure 5 shows an example of the sensor data for smoke particles at the three wavelengths. Figure 5(a) shows the PTR signals of the three wavelengths in an environment where TF25 smoke particles were flowing in, and the red triangle represents the index kmin obtained using by the algorithm. Figure 5(b) shows the ratio of the scattering intensities at wavelengths 470 and 850 nm, and the valid interval S obtained using the algorithm is shown by the solid red line. Figure 6 shows the statistical properties of the scattering intensity ratios in the valid intervals obtained from the results of the smoke particle generation experiments using the same algorithm on all sources from TF01 to TF50. Five TF results from the smoke particle experiments based on fire sources and non-fire alarm sources are shown, and the scattering intensity ratios based on wavelength are shown using boxplots and sample mean values. The boxplots for all data are labeled TOTAL; the boxplots for the data obtained after the index that was extracted via tabular CUSUM are labeled CUSUM; finally, the boxplots for the scattering intensity ratios of the valid data intervals are labeled MOVVAR. Unstable characteristics were observed in the data before the algorithm was applied owing to the presence of numerous outliers. After the algorithm was applied, relatively constant scattering intensity ratios were obtained in the valid data intervals. A comparison between the fire sources and non-fire alarm sources show limitations in performing the direct classification of smoke particles using only the scalar values of the scattering intensity ratios; however, water vapor, which is a non-fire alarm source, showed a different trend compare with the other sources. The scattering intensity ratios of water vapor in TF31-TF40 were lower than those of TF01-TF30. Among the non-fire alarm sources, the frozen meat experiments, i.e., those pertaining to TF41-TF50, exhibited nonuniform scattering intensity ratios as compared with the other test cases. As presented in [14], the frozen meat experiment exhibited features that increased gradually in an irregular manner, which is attributable to the fact that the generated smoke particles included a significant amount of water vapor, as reported in [1].
The same algorithm was applied to all cases from TF01 to TF50 to extract the index kmin, valid interval S, and valid sample mean via a sample mean filter, and the results are shown in Table 2. The asterisks (*) next to the valid interval S values in Table 2 indicate that the intervals are not continuous. Using the experiment chamber and the data acquisition device fabricated in this study, the fire sources were confirmed to exhibit high scattering intensity ratios of 1.7-2.7, whereas vapor, a non-fire alarm source, exhibited scattering intensity ratios of 0.7-1.1. Meanwhile, frozen meat, which is a non-fire alarm source, could not be defined by its sample mean value, and it exhibited different properties owing to its wide ranging variance values. Analog Devices [14] reported scattering intensity ratios of 2.4-3.5 for fire sources and a low scattering intensity ratio of 1.4 for vapor owing to the experimental environment and settings, which differed from those of the current study. In addition, the non-fire alarm sources from cooking indicated a scattering intensity ratio of 3.3, which is similar to the results of this study.
5. Conclusion
In this study, the statistical characteristics of the scattering intensity ratios of smoke particles were investigated using light sources with three wavelengths. Simulations were performed to calculate the scattering efficiency at those three wavelengths. The results showed that the scattering efficiency ratios can be used to distinguish particles measuring 1 ┬Ąm using a set of adjacent wavelengths at 470 and 525 nm and a set of wavelengths at 470 and 850 nm. An algorithm was designed to extract the index at which scattering begins when smoke particles flow in, as well as to extract the valid data index from unstable data under conditions in which feature extraction is limited, while considering the structure of an actual smoke detector. To perform smoke generation experiments on fire sources and non-fire alarm sources, a data acquisition device was fabricated by combining sensors that can detect the three selected wavelengths. In addition, an experiment chamber for generating smoke particles was designed, and the data acquisition device was installed in it. Five fire sources and non-fire alarm sources were selected, and fire experiments were performed in the experimental chamber to obtain data.
The data obtained were categorized into three cases, and a statistical analysis of the scattering intensity ratios was performed. Boxplots were constructed and sample mean values were obtained for the overall data, the data acquired after the index was extracted via tabular CUSUM, and the data of the valid data intervals. The fire source cases indicated higher scattering intensity ratios than water vapor, which is a non-fire alarm source. Meanwhile, frozen meat, which is a non-fire alarm source, indicated non-uniform scattering intensity ratios. The same algorithm was applied to all experiments to extract the valid intervals and sample means, and the results showed that the fire sources exhibited high scattering intensity ratios of 1.7-2.7, whereas vapor, which is a non-fire alarm source, exhibited low scattering intensity ratios of 0.7-1.1. In addition, frozen meat, which is a non-fire alarm source, exhibited different properties owing to its wide ranging variance values, although its sample means were unstable.