Comparative Study of Numerical Simulation and Experiment on Temperature Distribution and Central Vent Flow Velocity in Ceiling-vented Compartment Fire
Article information
Abstract
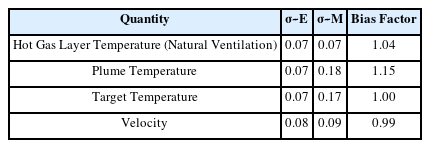
In this study, we conducted numerical simulations to analyze fire phenomena in a compartment with a ceiling vent and compared these numerical simulation results with previous experimental data. Based on the previous experimental conditions, under the heat release rate of 1.5 kW, the vent areas of 1% and 10% of the floor area and the fire sources both at the center and side of the floor were tested. Overall trends of temperature distribution and central vent flow velocity in the present numerical simulations were consistent with those in the previous experiments. The temperature within the compartment was observed to be higher when the vent area was smaller. For compartment with a smaller vent area, the temperature distribution showed minor variations with the fire source location. However, with a larger vent area, temperatures were notably higher when the fire source was at the side than at the center. The present numerical simulations slightly overestimated the temperatures from the previous experimental results, resulting in a bias factor of 1.07 and a model's relative standard deviation of 0.07 for temperature. Regarding the flow velocity at the center of ceiling vent, the fluctuations over time were more pronounced when the fire source was centrally located. When the fire source was at the center, the average central vent outflow velocity was higher for compartment with a larger vent area. When the fire source was positioned to the side, the vent area appeared to have minimal impact on the average central vent outflow velocity. It was also observed that the average central vent outflow velocity was higher when the fire source was centrally placed when compared to a side location. The present numerical simulations underestimated the previous experimental results for the average central vent outflow velocity, and the bias factor and the model’s relative standard deviation for the average central vent outflow velocity were 0.63 and 0.39, respectively.
1. Introduction
In a compartment fire, the vent conditions are closely associated with the compartment fire phenomena, such as temperature distribution in the compartment, smoke layer thickness and temperature, and vent flow pattern and mass flow rate. One of the important vent conditions determining the fire phenomena is the location of the vent. For example, the aforementioned fire phenomena in the compartment will be different between a compartment fire with a horizontal vent on the ceiling and that with a vertical vent on the side wall. Therefore, it is necessary to conduct research on fire phenomena under various vent conditions. This aids in understanding and predicting the compartment fire phenomena and in designing buildings to reduce human and property damage.
On the other hand, research on compartments with ceiling vents is applicable in atriums, theater, and ships [1]. Some studies on fire phenomena in compartments with ceiling vents have been reported [1-5]. Zhang et al. [1] conducted a numerical simulation on the effects of ceiling vent location (center and corner) on smoke filling process, oxygen concentration, gas temperature, and vent flow characteristics (pressure, velocity, and mass flow rate) in a compartment fire with a natural ceiling vent. Park et al. [2] investigated the effects of vent area and heat release rate (HRR) on fire phenomena in a compartment with a single ceiling vent when the fire source was located at the center of the compartment. They performed numerical simulations for three conditions of vent area and three conditions of HRR and examined the temperature distribution in the compartment, vent flow pattern, velocity distribution, and mass flow rate. Park et al. [3] investigated the scaling law for fire phenomena in a compartment with a single ceiling vent. Numerical simulations of a large compartment fire and a small compartment fire were conducted based on the scaling law. The simulations verified the accuracy of the scaling law in terms of the effects of the vent area and fire source location on the mass flow rate discharged via the ceiling vent, the temperature distribution in the compartment, and the velocity of the flow passing through the ceiling vent. Some previous studies [1-3] reported that under the condition where a single ceiling vent was installed, bidirectional flow was observed, which was the simultaneous appearance of inflow and outflow through the vent. On the other hand, some studies investigated the fire phenomena under the condition of two ceiling vents. Park and Lee [4] examined the effects of the duct height of two ceiling vents and the location of the fire source on the vent flow pattern, mass flow rate, and temperature distribution in the compartment. Subsequently, Park and Lee [5] measured the flow pattern and mass flow rate through the vent with the area ratio of the two ceiling vents and analyzed the relationship between the vent flow and temperature distribution in the compartment. In the presence of two ceiling vents, bidirectional flow or unidirectional inflow was observed at each vent, and the flow combination was determined by the vent conditions. Considering the previous studies [1-5], it was reported that a fire in a compartment with a ceiling vent led to a very complex vent flow, which had a significant impact on the fire phenomena in the compartment. Additionally, in the previous studies [1-5], numerical simulations were conducted using the fire dynamics simulator (FDS). The accuracy of these FDS-based simulations, especially concerning fire phenomena in compartments with ceiling vents, needs to be checked.
FDS is a large eddy simulation (LES)-based computational fluid dynamics (CFD) program [6] developed by the National Institute of Standards and Technology (NIST) to implement fire phenomena related to the movement of heat and smoke and has been widely used in the field of fire safety modeling. Meanwhile, the validation of the prediction performance of FDS has been conducted to check the reliability of fire modeling using FDS. To examine the prediction performance of FDS, the bias factor and relative standard deviation based on the measured values of experiments and predicted values of numerical simulations are reported in NUREG-1824 [7] published by the Nuclear Regulatory Commission (NRC). The bias factor is a measure of the difference between the experiment and numerical simulation, and it can be actively utilized to more accurately predict the actual fire phenomena from the numerical simulation results for the certain fire conditions. The bias factor (δ) and model’s relative standard deviation (
where M denotes the value predicted by FDS, E denotes the experimentally measured value, n denotes the number of data, and
In this study, we performed numerical simulations using FDS based on a previous study conducted by Park and Lee [11] on the fire experiments in a compartment with a ceiling vent. We examined the temperature distribution inside the compartment and central vent flow velocity via numerical simulations. Furthermore, we obtained the bias factor and the model’s relative standard deviation for the temperature distribution inside the compartment and the average central vent outflow velocity by comparing the present numerical simulation results with the previous experimental results [11].
2. Numerical Simulation Methodology
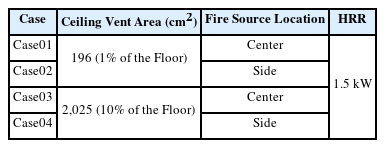
In this study, numerical simulations were performed using FDS (ver. 6.7.3) for some of the experimental conditions used by Park and Lee [11]. To examine the effects of the ceiling vent area and the fire source location, numerical simulations were performed for the cases where the ceiling vent area was 1% and 10% of the floor area, and the fire source was located at the center or side of the compartment floor. Meanwhile, the HRR of 1.5 kW was the same for all conditions. A total of four conditions were simulated. Table 2 lists a summary of the simulation conditions in this study.
Numerical Simulation Conditions
In this study, the compartment of numerical simulations was constructed with the same size and shape as the experimental setup of Park and Lee [11]. Figure 1 shows the schematic diagram of the numerical simulation and measurement locations. The compartment dimensions were 204 cm (width) × 100 cm (depth) × 110 cm (height), and a ceiling vent was installed in the center of the ceiling. In this study, we considered the cases where the ceiling vent areas were 1% and 10% of the floor area, which corresponded to 196 cm2 (14 cm × 14 cm) and 2,025 cm2 (45 cm × 45 cm), respectively.

Schematic of numerical simulation.
We measured the temperature distribution inside the compartment and flow velocity via the ceiling vent. The measurement locations in this study were the same as those in the previous study [11]. For the temperature distribution inside the compartment, we installed a total of five thermocouple trees (TCs). TC1-4 were located at 86, 51, 34, and 51 cm from the center of the compartment floor, respectively, and were set up to measure temperature at 20 cm intervals in the height direction from the floor at each TC. TC5 was located at the center of the floor and set to measure temperature at heights of 80, 90, and 100 cm from the floor. Hence, we measured the temperature distribution inside the compartment at a total of 23 points. Furthermore, we measured the flow velocity through the center of the ceiling vent.
The fire source was set up as follows. The fire source was located at the center or side of the compartment floor. In the case of the fire source located at the side of the compartment floor, it was positioned 20 cm away from the wall. The fuel was methanol, and the fire growth rate and fire growth factor were set to ultrafast and 0.1876 kW/s2, respectively, by applying the t-square fire model [12].
The grid size was set by considering the plume resolution index (D*/δx), where D* denotes the characteristic fire diameter and δx denotes the grid size. The characteristic fire diameter is defined by Eq. (4) as follows:
where
3. Results and Discussion
3.1 Temperature distribution
For the temperature distribution inside the compartment, we compared the present numerical simulation results with the previous experimental results [11], as shown in Figure 2. Overall, the results of the present numerical simulation and previous experiment [11] showed the same trend. In the compartment, a higher temperature was observed in the cases with a small vent area (Case01 and Case02) when compared to those with a large vent area (Case03 and Case04), given each fire source location condition. For TC1-TC4, the difference in temperature distribution inside the compartment with the fire source location was not significant in the cases with a small vent area (Case01 and Case02). However, in the cases with a large vent area (Case03 and Case04), the temperature was found to be higher when the fire source location was at the side (Case04) rather than at the center (Case03). Meanwhile, for TC5, the temperature was higher when the fire source location was at the center (Case01 and Case03) than at the side (Case02 and Case04). This is attributed to TC5 being a temperature measurement point aligned with the center axis of the fire source when its location is at the center.
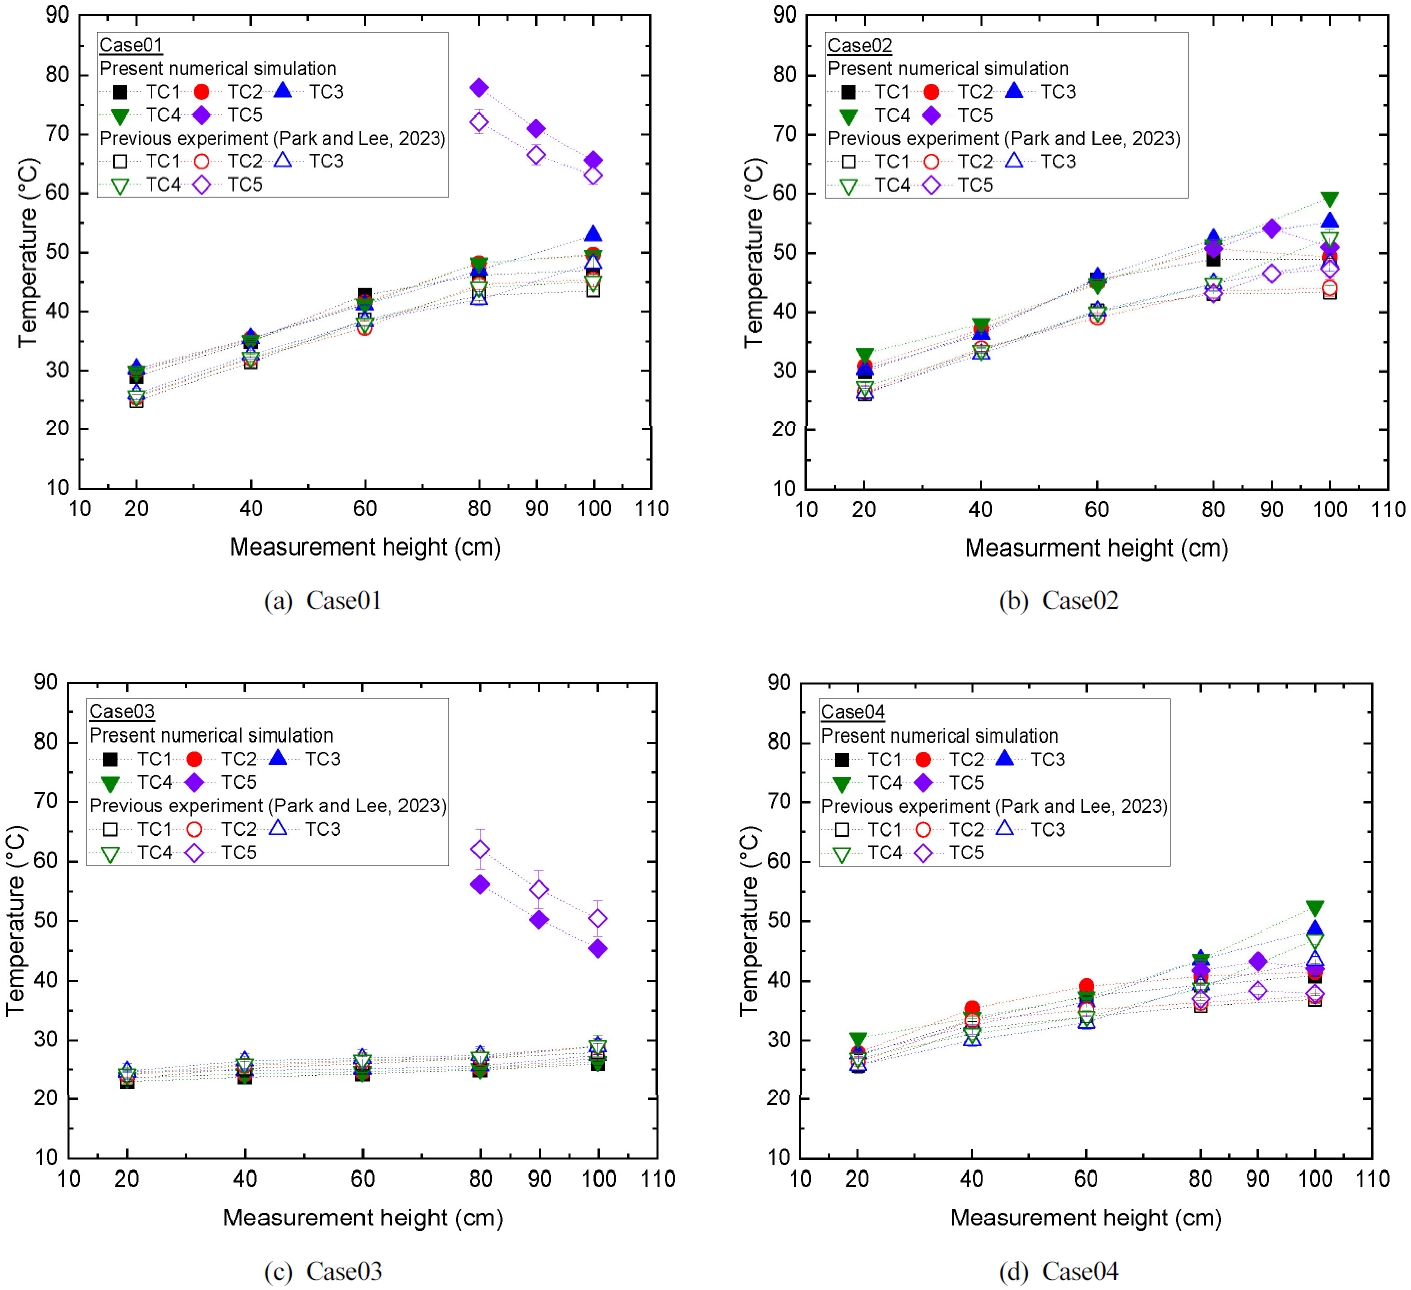
Figure 3 presents the visualization of temperature distribution, reflecting a similar trend as observed in Figure 2. Of all the conditions, the case with a large vent area and the fire source located at the center (Case03) showed the lowest temperature. This is because the high-temperature fire plume, produced by the fire source, can flow out efficiently via the ceiling vent. Meanwhile, the visualization of the temperature distribution near the ceiling vent revealed a bidirectional flow, characterized by both outflow and inflow through the ceiling vent.

Visualization of temperature distribution for Case01-Case04.
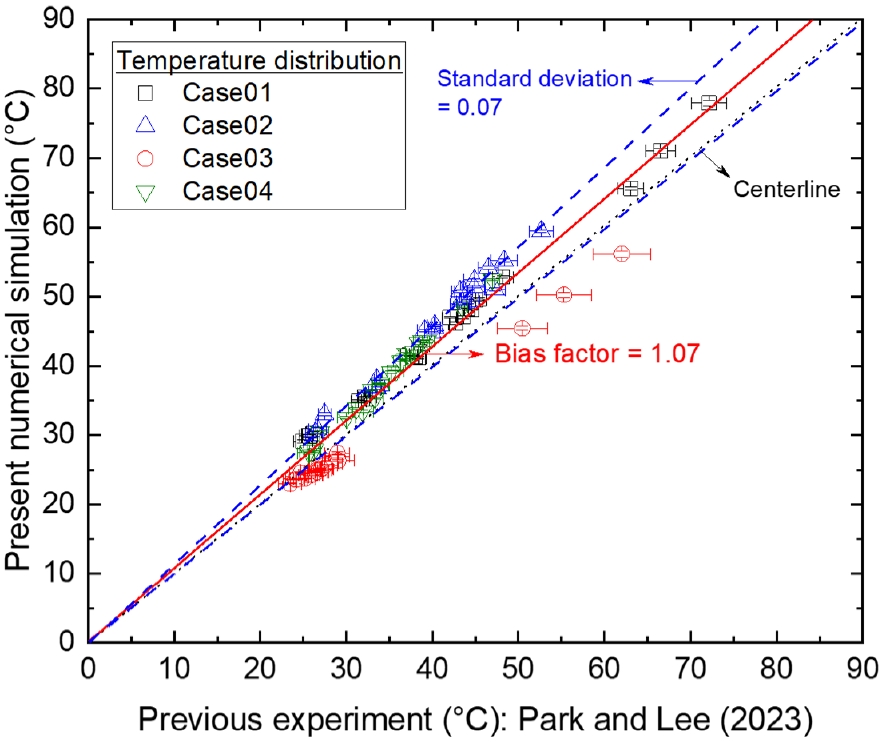
Based on the temperature distribution shown in Figure 2, we compared the present numerical simulation results with the previous experimental results [11], as shown in Figure 4. Overall, the present numerical simulation slightly overestimated the previous experimental results [11]. Based on the temperature distribution data, the bias factor and model’s relative standard deviation were calculated using Eqs. (1)-(3), which were 1.07 and 0.07, respectively.
3.2 Central vent flow velocity
Figure 5 shows the present numerical simulation results for the central vent flow velocity, i.e., the flow velocity measured over time at the center of the vent. It was observed that the time-based variation of central vent flow velocity was greater when the fire source was located at the center (Figure 5(a)) than at the side (Figure 5(b)).
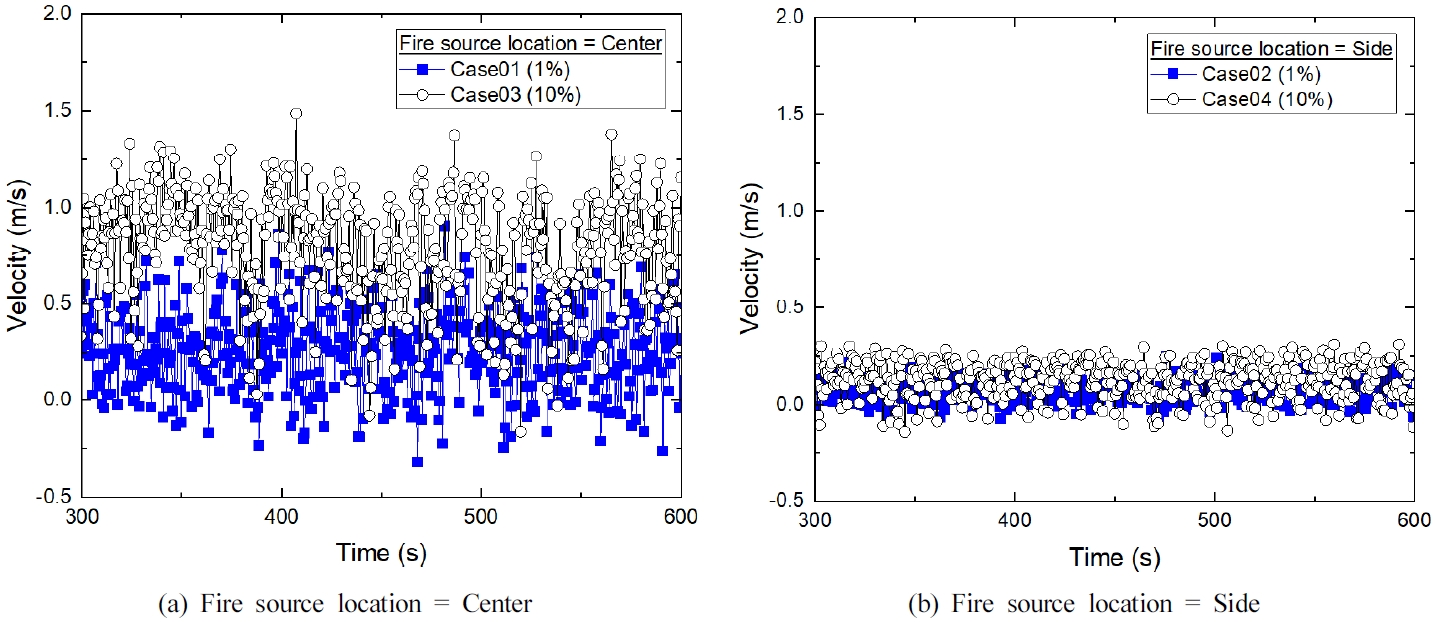
Temporal variation of central vent flow velocity in the present numerical simulation.
Figure 6 shows the influence of the vent area on the average central vent outflow velocity. This average was calculated by taking the mean of the positive velocities within the 500-600 s interval in the temporal variation in central vent flow velocity. The simulation results revealed that in the cases with the fire source at the center (as shown in Figure 6(a)), the average central vent outflow velocity was higher for a larger vent area (Case03) than for a smaller area (Case01). This trend was consistent with previous experimental result [11]. In the cases with the fire source positioned at the side (Figure 6(b)), the simulations indicated a slightly higher average central vent outflow velocity for the larger vent area (Case04) when compared to the smaller vent area (Case02). This seemed to contrast with the trend reported in the previous experimental results [11]. However, given the small difference in average values and relatively large error bars between Case02 and Case04 in both the present simulation and the previous experiment [11], it was concluded that the vent area's impact on the average central vent outflow velocity was minor when the fire source was located at the side.
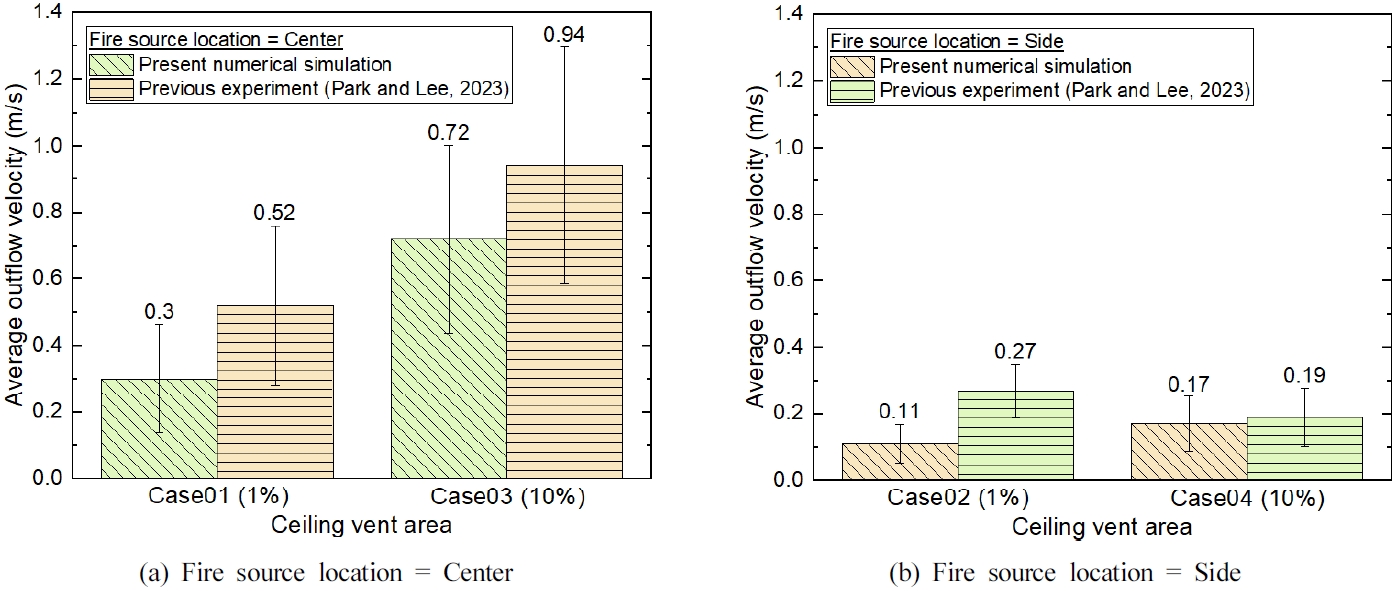
We also analyzed the effect of the fire source location on the average central vent outflow velocity. The simulation results indicated that regardless of the vent area, large or small, the average central vent outflow velocity was higher when the fire source was positioned at the center (Case01 and Case03) when compared to the side (Case02 and Case04). This observation was consistent with previous experimental results [11].
Figure 7 shows a comparison between the present numerical simulation results and previous experimental results [11] in terms of the average central vent outflow velocity. Overall, the present numerical simulation underestimated the previous experimental results [11]. Based on the average central vent outflow velocity data, the bias factor and model’s relative standard deviation were calculated using Eqs. (1)-(3), which were 0.63 and 0.39, respectively.

In this study, we performed numerical simulations based on the previous experimental study [11], and in the case of the ceiling vent flow velocity, we focused on the velocity measured only at the center of the ceiling vent. To clearly analyze the fire phenomena, including the ceiling vent flow behavior and temperature distribution, it is considered that in the future, the velocity of the ceiling vent flow should be measured at various points to obtain data on the velocity distribution. Furthermore, a detailed analysis of those data and comparison between experiments and numerical simulations should be performed.
4. Conclusions
In this study, we performed numerical simulations of the fire phenomena in a compartment with a ceiling vent and compared the numerical simulation results with the previous experimental results [11]. Considering the conditions of the previous experimental study [11], under the HRR of 1.5 kW, the vent areas of 1% and 10% of the floor areas and the fire source locations to the center and side of the floor were tested. Through the numerical simulations, the effects of the vent area and fire source location on the temperature distribution in the compartment and the central vent flow velocity were examined and compared with the previous experimental results [11]. Based on the present numerical simulation results and previous experimental results [11], the bias factor and model’s relative standard deviation were obtained for the temperature distribution in the compartment and the average central vent outflow velocity in a fire of a compartment with a ceiling vent.
The overall trends in the temperature distribution and central vent outflow velocity were similar between the present numerical simulation and previous experiment [11]. For the temperature distribution within the compartment, we found that a smaller vent area led to higher temperatures when compared to those for a larger vent area. In the cases with a small vent, the fire source location did not significantly affect the temperature distribution. However, in the cases with a larger vent, temperature distribution was higher when the fire source was at the side than at the center. The temperature distribution was observed to be the lowest when the vent area was large and the fire source was centered. Present numerical simulations slightly overestimated the previous experimental results [11], and the bias factor and model’s relative standard deviation for the temperature were 1.07 and 0.07, respectively.
As for the central ceiling vent velocity, we observed a more pronounced time-based fluctuation in flow velocity when the fire source was centered compared to when it was at the side. For a centrally located fire source, a larger vent area resulted in a higher average central vent outflow velocity than a smaller vent area. Conversely, when the fire source was at the side, the vent area had a little impact on the average central vent outflow velocity. Additionally, the average central vent outflow velocity was higher with a central fire source than a side one. Present numerical simulations underestimated the previous experimental results [11], and the bias factor and model’s relative standard deviation for the average central vent outflow velocity were 0.63 and 0.39, respectively.
Notes
Author Contributions
Conceptualization, M.Y.; methodology, M.Y.; investigation, M.Y.; writing—original draft preparation, M.Y. and Y.Y.; writing—review and editing, C.Y.; visualization, M.Y., Y.Y. and C.Y.; supervision, C.Y. All authors have read and agreed to the published version of the manuscript.
Conflict of Interest
The authors declare no conflict of interest.
Acknowledgements
This study was supported by the National Research Foundation of Korea (NRF) grant funded by the Korea government (MSIT) (No. 2019R1F1A1062867). This paper was supported by the "National Fire Agency" R&D program [grant number 20016433]. This manuscript was prepared by revising and improving the content of the first author's master thesis.