Global Climate Change Analysis based on Shared Socioeconomic Pathway Scenarios and Disaster Damage Analysis Using Hazards-US (HAZUS)
Article information
Abstract
In this study, a global temperature rise by +1.9 to 5.2 ℃ was expected at the end of the 21st century due to greenhouse gas emissions based on a report from the Intergovernmental Panel on Climate Change, and a 1.6 ℃ increase in annual average temperature in Korea over the last 109 years (1912 to 2020) was confirmed. These climate changes have increased heat waves and extreme climate indices worldwide, and natural disasters have increased in Korea due to irregular changes in heat waves and precipitation. In addition, this study on disaster damage estimation was conducted using Hazards-US-Multi-Hazard (HAZUS-MH), a disaster damage assessment platform used in the United States. HAZUS-MH was selected because it is stable and robust for various disaster scenarios as well as specific geographical and climate conditions and is reliable for disaster management and response even though it has difficulty reflecting specific domestic environments. The results showed that seismic damage reduction costs can be significantly decreased through the integration of early warning and preventive measures under the scenario of Pohang earthquake magnitude 5.4. This study provides insight into domestic climate change and disaster management and emphasizes the need for future response and model development. An effective response to climate change is expected to play an important role in ensuring national and regional safety and stability.
1. Introduction
In modern society, climate change is a major factor that significantly affects human life and survival. Abnormal temperatures, such as heat waves and cold waves, and natural disasters, such as typhoons, floods, and droughts, occur frequently, and damages are increasing. According to the World Meteorological Organization (WMO), 80% of the natural disasters that occurred over 10 years from 2005 to 2015 are closely related to climate change[1]. In particular, global warming raises the overall sea level by expanding ocean water and melting Arctic glaciers, thereby causing natural disasters, such as the flooding and extinction of densely populated coastal cities[2]. The rise in average temperature caused by global warming is also accelerating desertification and increasing the area of forest fires and related damage[3]. These impacts are causing direct problems in terms of the formation and maintenance of human society and ecosystems. In other words, climate change increases economic losses; reduces crop yields due to high temperatures, precipitation concentration, water shortage, and rising sea levels; and causes emergencies such as coastal flooding and new infectious diseases[4,5]. The ongoing occurrence of abnormal climate phenomena and the insufficient preparation and response capabilities of local communities may result in the worst damage in the event of a natural disaster. Recently, natural disasters have increased in size and frequency. In addition, disaster types have diversified. New records are emerging for rainfall and heavy snow every year, and their damage is rapidly increasing[6]. Various types of natural disasters, including typhoons, floods, earthquakes, and tsunamis, also occur daily. Therefore, more effective preparation and response strategies for natural disasters caused by climate change are urgently required.
In this study, global climate change was predicted and domestic climate change trends were analyzed based on a report from the Intergovernmental Panel on Climate Change (IPCC) and a report on domestic climate change from the Korea Meteorological Administration to identify the causes of climate change-induced natural disasters. In addition, the disaster damage was estimated using Hazards-US-Multi-Hazard (HAZUS-MH), a disaster damage assessment platform. The study proposes ways to prepare for potential threats caused by future climate change and reduce social vulnerability.
2. Global Climate Change Forecast based on IPCC Report
2.1 Overview of IPCC
The IPCC is an international organization jointly established in 1988 by the WMO and the United Nations Environment Program (UNEP) to deal with climate change. The IPCC assessment reports, published by scientists across the world, provide scientific grounds and policy directions for climate change and are used as basic data for intergovernmental negotiations at the United Nations Framework Convention on Climate Change (UNFCCC)[7,8]. The IPCC published six assessment reports from 1990 to 2023. In this study, the global climate change forecast was analyzed based on the sixth assessment report.
The global climate change forecast described in the IPCC assessment report presents Shared Socioeconomic Pathway (SSP) scenarios for climate change based on greenhouse gas (GHG) pathways. These scenarios are used to examine the possibility of climate change considering various future situations according to socioeconomic and environmental factors. The SSP scenarios are divided into four groups. SSP1-2.6 is a low-emission scenario that mitigates climate change through a reduction in social imbalance and the development of eco-friendly technologies and pursues a sustainable economic structure. SSP2-4.5 is a scenario that assumes intermediate levels of climate change mitigation and socioeconomic development. SSP3-7.0 is a scenario of an economic structure vulnerable to climate change due to imbalances in socioeconomic development and institutional restrictions, which is classified as a basic scenario. Finally, SSP5-8.5 is a high-emission scenario with high climate change adaptability but low mitigation ability despite high human investment based on fossil fuels due to the absence of climate policies. These scenarios consider future possibilities, investigate the potential effects of climate change, and provide useful information for response to climate change and policy-making[9]. Table 1 summarizes the four standard SSP scenarios.

Four SSP Standard Scenarios
2.2 Global climate change forecast
Figure 1 shows the change in global average temperature according to GHG emissions[10]. The global average temperature at the end of the 21st century (2081 to 2100) is expected to increase by +1.9 to 5.2 ℃ compared to the present (1995 to 2014) depending on GHG emissions as shown in Figure 1(a). In addition, as shown in Figure 1(b), the temperature rise is different between the land and the ocean. The temperature is expected to increase by +2.5 to 6.9 ℃ for the land and by +1.6 to 4.3 ℃ for the ocean. In the Arctic region, in particular, the temperature increase is greater compared to the land. The Arctic temperature is expected to increase by +1.6 to 13.1 ℃. As shown in Figure 1(c), a temperature rise of +1.7 to 7.8 ℃ is also expected for each continent at the end of the 21st century (2081 to 2100).
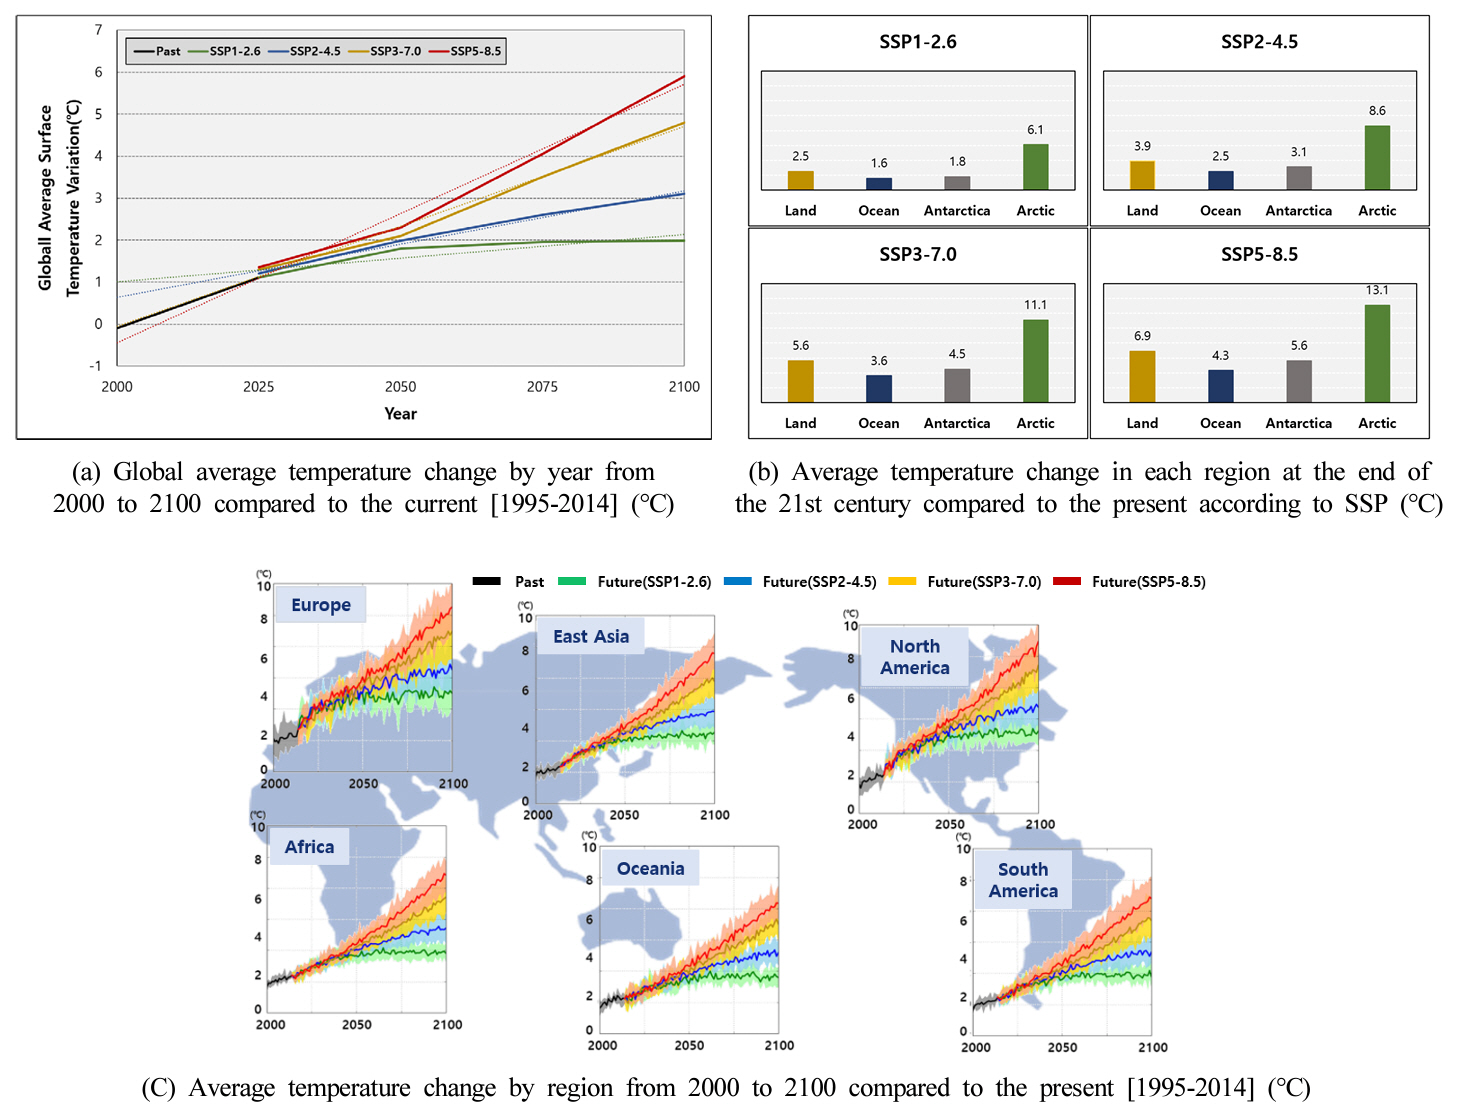
Change in global average temperature due to greenhouse gas emissions.
Figure 2 shows the change in global average precipitation due to GHG emissions. The global average precipitation at the end of the 21st century (2081 to 2100) is expected to increase by +5 to 10% compared to the present (1995 to 2014) depending on GHG emissions as shown in Figure 2(a). As shown in Figure 2(b), the precipitation increase is different by region; however, significantly increasing tendencies (+7 to 17%) were observed in the equator and high altitudes of over 60o in the northern hemisphere.
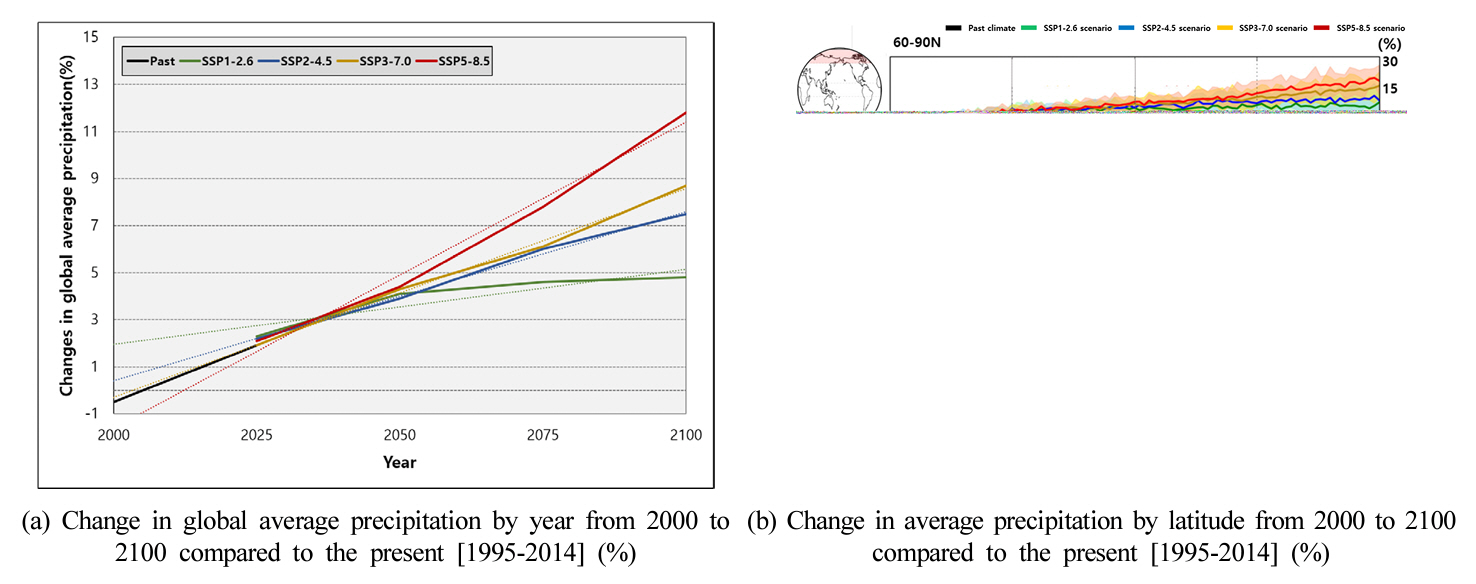
Change in global average precipitation due to greenhouse gas emissions.
Figure 3 shows the changes in global average sea surface temperature due to GHG emissions[10]. The global average sea surface temperature at the end of the 21st century (2081 to 2100) is expected to increase by +1.4 to 3.7 ℃, and the sea surface height is expected to increase by +46 to 87 cm compared to the present (1995 to 2014) depending on GHG emissions.

Change in global average sea surface temperature by year from 2000 to 2100 compared to the present [1995-2014] (℃).
Figure 4 shows the change in global average sea ice due to GHG emissions. The global average sea ice at the end of the 21st century (2081 to 2100) is expected to decrease by 19 to 76% in the Arctic and by 20 to 54% in Antarctica compared to the present (1995 to 2014) depending on GHG emissions as shown in Figure 4(a). It was also predicted that summertime sea ice in the Arctic will almost disappear after the mid-21st century under all scenarios.
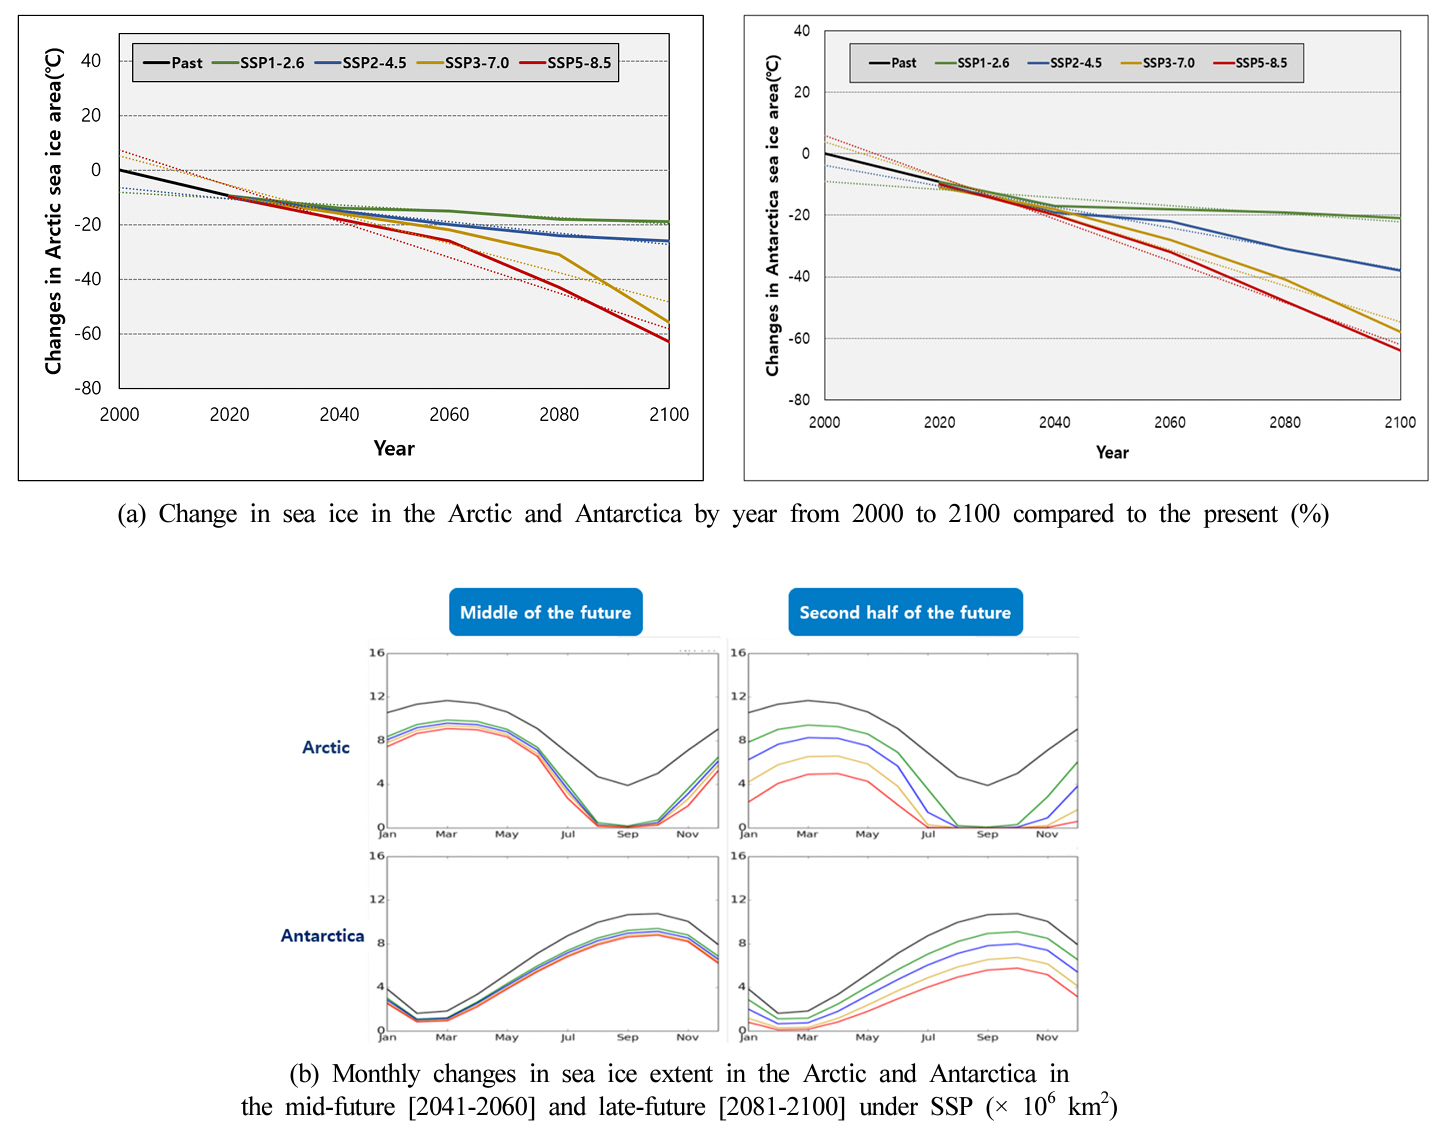
Change in global average sea ice due to greenhouse gas emissions.
The above results show that climate change may vary depending on GHG emissions and that it is necessary to make efforts to mitigate the negative effects of climate change in the future. The climate change presented in the sixth assessment report from the IPCC may lead to natural disasters, such as droughts and floods, due to changes in heat waves, extreme climate indices, and precipitation. Measures to prepare for such disasters are required.
3. Domestic Climate Change Trends from 1912 to 2020
On a global scale, climate change directly impacts human lives. In Korea, climate change has also negatively affected industries and economic activities. Therefore, in this study, the climate conditions in Korea were analyzed based on annual average temperatures, GHS emissions, temperature rise, precipitation, and extreme climate indices.
Figure 5 shows changes in average annual maximum, average, and minimum temperatures over 109 years (1912 to 2020)[11]. The average annual temperature in Korea has continuously increased, and the average annual minimum temperature has also increased. Over the last 109 years (1912 to 2020), the average annual temperature has increased by 0.20 ℃ every 10 years, and the average annual maximum and minimum temperatures have increased by 0.13 and 0.24 ℃ every 10 years, respectively. In addition, compared to the past 30 years (1912 to 1940), the average annual temperature in the last 30 years (1991 to 2020) increased by 1.6 ℃ and the maximum and minimum temperatures also increased by 1.1 and 1.9 ℃, respectively.
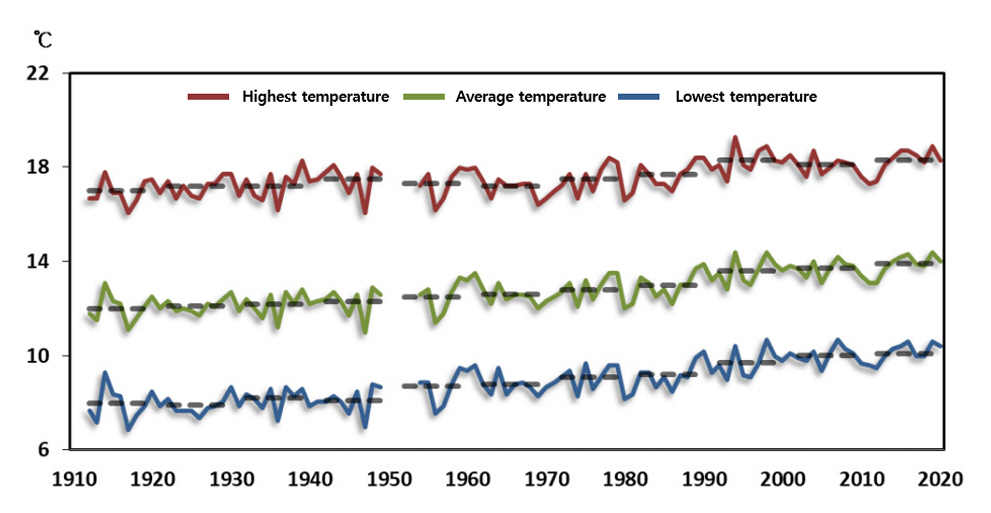
Changes in average annual maximum, average, and minimum temperatures (1912-2020).
Figure 6 shows temperature and CO2 concentration change trends around the world and in Korea, and Figure 7 compares Korea's and the global annual average temperatures and CO2 increases[11]. When changes in temperature and CO2 concentration over 109 years (1912 to 2020) were observed, the temperature rise caused by GHG emissions also showed a clear tendency. Compared to the global results, Korea's annual average temperature increased by +1.6 ℃ and its CO2 concentration was +6.5 ppm higher, indicating that the domestic warming rate is higher than the global average.
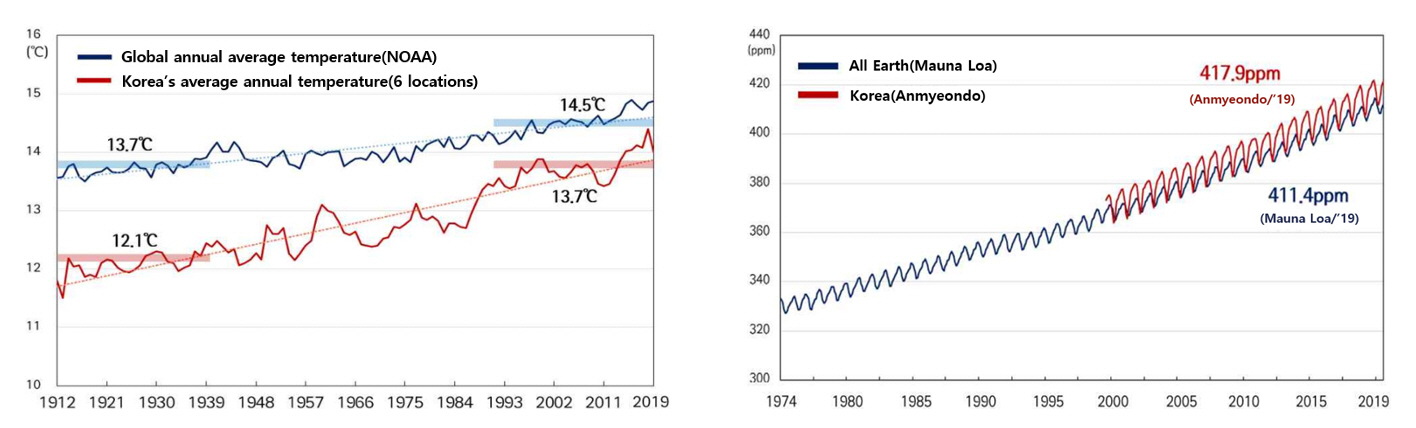
Temperature and CO2 concentration change trends around the world and in Korea.
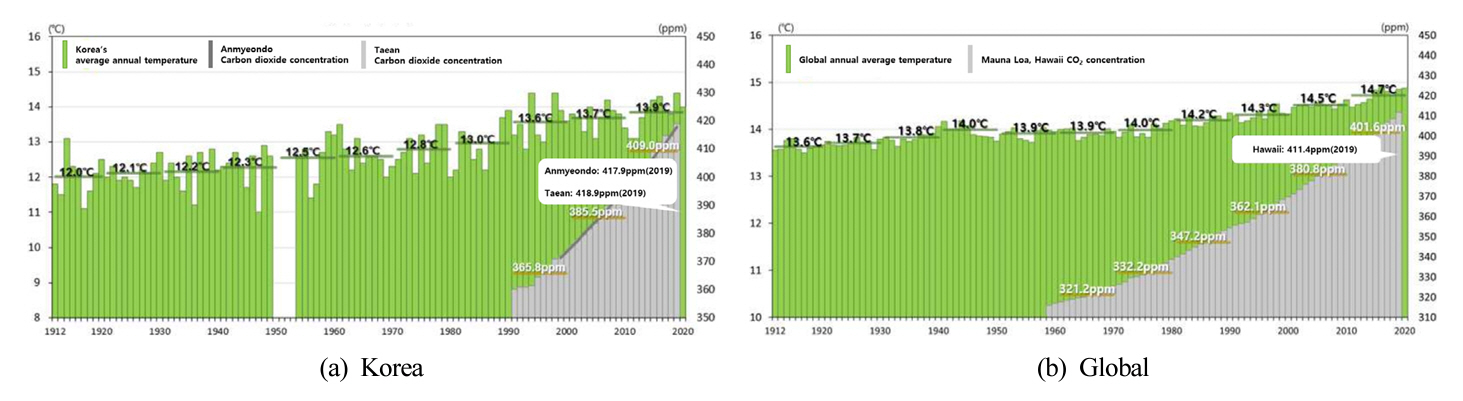
Korea, comparison of global annual average temperature and CO2 increase.
Figure 8 shows changes in annual precipitation, number of days with precipitation, and intensity of precipitation over 109 years (1912 to 2020). The precipitation tended to increase by +17.71 mm every 10 years over 109 years (1912 to 2020). It increased by 135.4 mm in the last 30 years (1991 to 2020) compared to the past 30 years (1912 to 1940). The number of days with precipitation tended to decrease by -2.73 days every 10 years over 109 years (1912 to 2020). It decreased by 21.2 days in the last 30 years (1991 to 2020) compared to the past 30 years (1912 to 1940).

Changes in annual precipitation, number of days with precipitation, and intensity of precipitation (1912-2020).
Figure 9 shows the trends of extreme climate change by year in Korea over 109 years (1912 to 2020). When changes in extreme climate indices over 109 years (1912 to 2020) were observed, heat-related indices, such as the numbers of heat wave days and tropical nights, increased, and the number of heavy rain days also showed a tendency to increase. The number of heat wave days and tropical nights increased by +1.0 and +8.4 days, respectively, in the last 30 years (1991 to 2020) compared to the past 30 years (1912 to 1940), whereas the number of heavy rain days increased by +0.6 days. However, the number of cold wave days and freezing days, decreased by -4.9 and -7.7 days, respectively. Overall, the domestic warming potential tends to increase through all seasons.

Trends of extreme climate change in Korea by era over 109 years (1912-2020).
As global warming accelerates, extreme climate phenomena that cause enormous damage, such as extreme heat and heavy rain, occur more frequently and strongly in Korea. Therefore, countermeasures to disasters and preparation for accelerating warming in Korea to ensure people's continued healthy daily lives are required.
4. Status of Abnormal Climate in Korea
According to overseas and domestic climate change statistics, the average temperature has continuously increased worldwide with increasing uncertainties about climate change. In particular, Korea has exhibited warming at a rate faster than the global average, and the frequency of heavy rains, heat waves, typhoons, and cold waves is gradually increasing. The climate in 2022 showed various characteristics in terms of temperature and precipitation. According to climate statistics, the average temperature in 2022 was 12.9 ℃, which is 0.4 ℃ higher compared to the average year and the ninth-highest level since 1973. In particular, it is the second-highest average temperature after 13.4 ℃ recorded in 2016. The year 2022 recorded various temperature rankings. Korea's annual average temperature, annual average minimum temperature, and annual average maximum temperature over 50 years (1973 to 2020) were ranked ninth, ninth, and eighth, respectively, showing high temperatures above average. In terms of precipitation, the annual average cumulative precipitation in 2022 was 1,150.4 mm. It was only 86.7% compared to the average year, recording little precipitation. In particular, precipitations in January, May, February, and July also exhibited low rankings, indicating overall changes in weather patterns. The abnormal climate status recorded in 2022 raises several key issues. Abnormal high temperatures occurred in April due to the occurrence of early summer heat, and early tropical nights and heat waves continued in summer. Strong cold continued in February. Early cold occurred in autumn and strong cold waves in early winter. In addition, concentrated monsoon and heavy rains in August were recorded in the central region of Korea, and the longest drought (227.3 days) since 1974 occurred in the southern region. In addition, five typhoons (No. 4 Aere, No. 5 Songda, No. 6 Trases, No. 11 Hinnamnor, and No. 14 Nanmadol) occurred in September for seven consecutive years and affected the country[12]. Figure 10 shows the damage caused by climate change[13,14]. Abnormal climate is increasing property damage and human casualties, with great impacts on our society and environment. An urgent response and countermeasures are required, and continuous environmental protection and response to climate change are important issues. Therefore, response to future disasters has been recently reinforced with the emergence of disaster damage assessment platforms. Such platforms quantify the scales and impacts of disasters using data and technology and enable effective responses to domestic and global disasters. They pursue continuous environmental protection and response to climate change beyond simple preparation. It is necessary to aggressively introduce disaster damage assessment platforms to minimize the impact of climate change and ensure a sustainable future.

Domestic torrential rain damage caused by climate change.
5. Disaster Damage Assessment Platform Analysis
5.1 Overview of disaster damage assessment platform HAZUS-MH
HAZUS-MH is natural disaster risk assessment software that utilizes the geographic information system (GIS). It is a useful tool in effectively managing and analyzing disaster-related information[15]. Figure 11 shows a schematic illustration of the disaster and disaster risk assessment methodology of HAZUS-MH[16]. HAZUS-MH enables the following tasks: pre-disaster impact assessment, establishment of emergency response and recovery plans, estimation of damage and loss scales, and establishment of countermeasures to minimize damage. HAZUS-MH provides risk models for various natural disaster types and can quantitatively assess the risks of disasters, such as earthquakes, floods, typhoons, and tsunamis. It is also helpful in estimating damage, economic losses, and social impacts using important information, such as population, buildings, and social infrastructure. HAZUS-MH consists of a physical module, a DB module, and a disaster vulnerability assessment module. The physical module is used to model the physical characteristics of disasters, such as earthquakes, typhoons, and floods, and to determine the physical damage caused by such disasters. The DB module integrates and provides data, such as information related to buildings and facilities, demographic and human resource information, and information on key public facilities (e.g., schools, banks, police stations, and fire stations). The disaster vulnerability assessment module evaluates disaster vulnerability for various types of building facilities to estimate damage and losses[17].
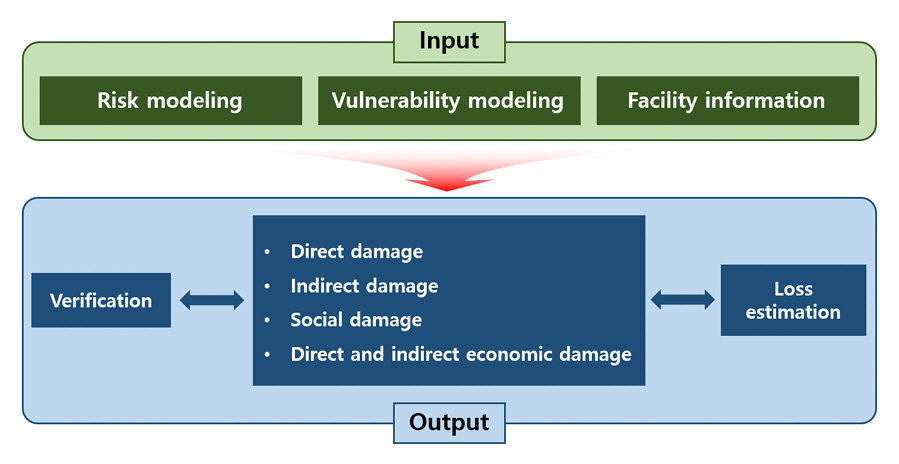
HAZUS-MH disaster and disaster risk assessment methodology.
5.2 HAZUS-MH research trends under the application of domestic disasters
In Korea, research has been actively conducted on the earthquake and flood models of HAZUS-MH. Regarding domestic research on the HAZUS-MH earthquake model, Kang et al.[18] evaluated seismic damage for some areas in the Korean Peninsula using the United States' HAZUS-MH. They confirmed the efficiency of HAZUS-MH in predicting and responding to natural disaster damage in all areas of the Korean Peninsula. Kang et al.[19] predicted seismic damage in Chungcheongnam-do, Korea using the HAZUS software of FEMA in the United States. Based on historical and instrumental earthquake data, they analyzed the damage due to virtual earthquakes that may occur in areas, such as Hongseong, Yesan, and Boryeong, and predicted the degree of damage to residential and commercial concrete buildings as well as human casualties. Jeong et al.[20] estimated direct damage and economic losses by comparing the Korea Building Act with the response spectrum of the scenario earthquake to evaluate seismic loss in Gangnam-gu, Seoul, Korea.
In terms of domestic research using the HAZUS-MH flood model, Lim et al.[21] conducted a case study on climate change in New York State mainly to assess the flood risk of the town of Lancaster. They focused on riverside flooding and explained the process of estimating the damage caused by flooding with cases using the HAZUS-MH model published by FEMA. Lee et al.[22] analyzed GIS-based HAZUS-MH developed by FEMA and developed a disaster loss estimation system applicable to Korea. They investigated the similarity between the flood model of HAZUS-MH and domestic databases to present a direction for developing Korean HAZUS-MH systems. Yu et al.[23] evaluated the expected loss caused by a flood with a 500-year return period in the Sopchoppy River area in Florida, USA using HAZUS-MH 2.1. They compared the results with the actual damage caused by tropical cyclone Debbie.
Previous studies conducted in the Korean Peninsula using HAZUS-MH focused on seismic and flood damage. In recent years, earthquakes have frequently occurred in Korea and the risk of flooding has increased due to various geological characteristics. To prepare for such potential disasters and minimize damage, various studies have been conducted using HAZUS-MH.
In this study, the earthquake model of HAZUS-MH was used to analyze the damage reduction cost by utilizing an early warning system. The damage reduction that may occur by applying an earthquake early warning (EEW) system in a domestic area and the resulting economic benefits were analyzed in detail to identify the value of the effective introduction of the early warning system in the area. This is expected to help the government and related agencies establish efficient disaster response policies and contribute to the safety and economic growth of local communities.
5.3 Analysis of damage reduction cost by EEW using HAZUS-MH
Earthquake early warning is a service that alerts the occurrence of an earthquake before the arrival of the S wave that causes seismic damage. It plays an important role in minimizing human casualties and property damage by securing time before the arrival of the S wave after observing the P wave. Short-distance evacuation, building evacuation, and calm communication on the situation are possible 5, 10, and 20 seconds before the arrival of the S wave, respectively[24]. In Korea, EEW was first introduced in 2015, and it took 50 seconds to issue a warning after the observation of an earthquake. Afterward, the time was reduced to 26 to 27 seconds for the magnitude 5.8 Gyeongju earthquake in 2016 and to 19 seconds for the magnitude 5.4 Pohang earthquake in 2017. Since August 2021, a fast-warning system has been provided and the time required to issue a warning has been reduced to 5 to 10 seconds after the observation of an earthquake with a magnitude of 5.0 or higher.
In this study, the effect of proper preventive measures and early warning against the magnitude 5.4 Pohang earthquake in preventing human casualties and property damage was evaluated using Eq. (1).
where C is the damage reduction cost, MD is the magnitude of the earthquake, N is the number of structures, DRR is the damage reduction rate reflecting the impact of EEW at that point, EWI is the impact of EEW at that time, and IF is the overall impact of structures being damaged at that point.
6. Results
This study analyzes the scenario of the magnitude 5.4 Pohang earthquake and the damage reduction cost of Nam-gu and Buk-gu in Pohang according to the early warning time. As shown in Table 2, the number of structures was set to 44,237 for Nam-gu and 49,287 for Buk-gu. The impact of early warning in each region and the total impact on structural damage were entered into the model. The model was executed using the set data, and the economic value losses of Nam-gu and Buk-gu were calculated when the early warning time was 1 to 20 seconds.

Setting Value to Analyze the Economic Loss Caused by Early Warning
In this study, human casualties and property damage according to preventive measures and early warning in the event of an earthquake were evaluated as economic values based on the scenario of the magnitude 5.4 Pohang earthquake as shown in Figure 12. The results showed that the damage reduction cost tended to increase as early warning was delayed in Nam-gu and Buk-gu. The damage reduction cost of Buk-gu was found to be higher than that of Nam-gu. This is due to the geographical characteristics of the earthquake and infrastructure layout. Buk-gu is considered more dangerous in the event of an earthquake. Its sensitivity to earthquakes, important economic activities, and concentration of residential areas may be different from those of Nam-gu. Since the infrastructure or building structures in Buk-gu can be more vulnerable to earthquakes, more cost is expected to be incurred for measures and preparation to reduce human casualties. As shown in Table 3, the early warning announcement time was reduced to 19 seconds for the Pohang earthquake compared to the Gyeongju earthquake. When it was shortened to 5 to 10 seconds, which is the current level, the economic loss was reduced by 60.4% for Nam-gu and 62.69% for Buk-gu. This proves that early warning plays an important role in disaster situations. The difference in the loss of economic value between Nam-gu and Buk-gu emphasizes the importance of early response in the event of an earthquake, emphasizing the need for effective disaster management and preparation policies.
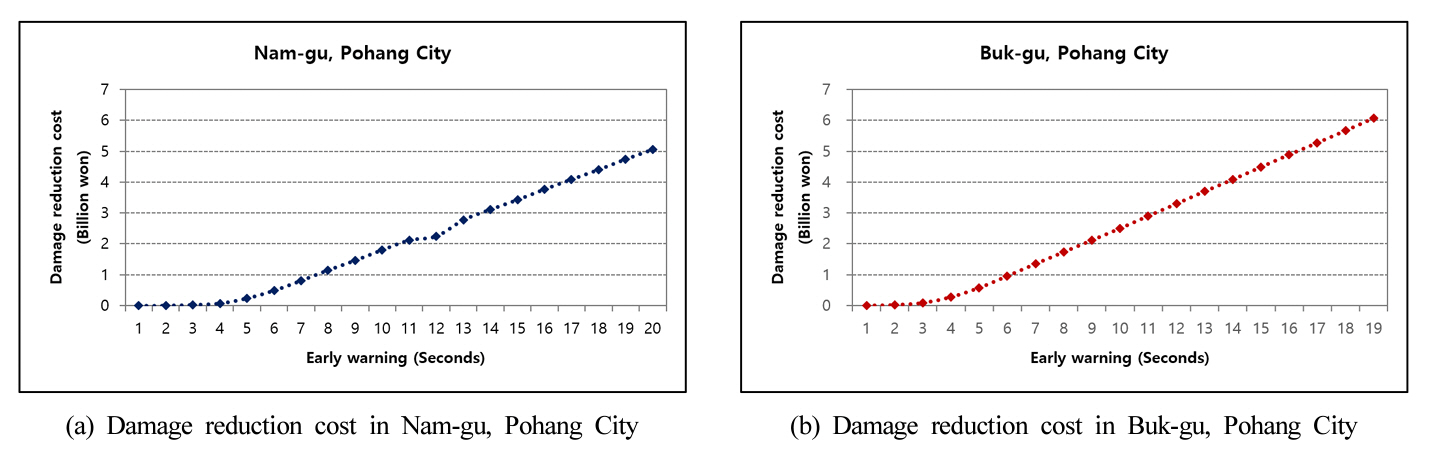
Damage reduction cost due to early warning when applying the magnitude 5.4 Pohang earthquake.

Current Rate of Loss of Economic Value with Early Warning Announcement Time
Since HAZUS-MH was developed primarily in the United States, it may be difficult to use it in specific domestic environments when calculating natural disaster damage in certain regions in Korea. In particular, the calculated damage reduction cost may not be accurate because the cost of loss according to the degree of damage may not match the economic structure of the region. In addition, since specific regional data in the United States are mainly used in the initial setting stage, it is difficult to properly reflect the unique characteristics of the target region when HAZUS-MH is applied in other countries or regions. Thus, using the data based on the United States when HAZUS-MH is applied in Korea limits damage prediction and assessment. Therefore, a new model considering domestic data and characteristics should be developed to accurately assess the damage caused by natural disasters in Korea.
7. Conclusion
In this study, the Korean domestic situation was analyzed in depth in terms of the frequency and damage of natural disasters caused by climate change. Amid the rapidly growing impact of climate change worldwide, various abnormal climate phenomena, such as heavy rains, heat waves, typhoons, and cold waves, have occurred in Korea. This has increased the frequency of disasters and subsequent damage, and an effective response to such disasters is essential. Therefore, in this study, the effect of the early warning system was examined by calculating the damage caused by natural disasters in Korea using HAZUS-MH. Using the scenario of the magnitude 5.4 Pohang earthquake, the results confirmed that the integration of early warning and preventive measures using HAZUS-MH can significantly reduce the damage reduction cost. When the early warning time was shortened to 5 to 10 seconds, which is the current level, the economic loss was reduced by 60.4% for Nam-gu and 62.69% for Buk-gu in Pohang City. The results of this study emphasized the importance of early warning in disaster situations. They indicated that the effective implementation of an early warning system can significantly reduce human casualties and economic losses and emphasize the need to construct an active early warning system in Korea. They also emphasized that it is necessary to develop a HAZUS-MH model that reflects domestic data and environments and to construct early warning systems continuously. This can protect human lives and properties from disasters and reinforce the ability of the country and its regions to respond to climate change. However, the application of HAZUS-MH in Korea involves the limitations of the model and the restrictions caused by using United States-based data. Therefore, new models and more domestic data are required to accurately reflect specific domestic environments.
In future research, various disaster damage assessment platforms, including IN-CORE and ERGO, as well as HAZUS-MH, should be examined to identify platforms that can be applied in Korea. Research on accurate and fast response to future disaster situations should be conducted focusing on developing natural disaster models specialized for Korea using various platforms and overcoming existing restrictions. This will contribute to accurate damage prediction and response strategy establishment considering domestic environments, geographical characteristics, and infrastructure.
Notes
Author Contributions
Conceptualization, S.O. and J.L.; methodology, J.L.; software, J.L.; validation, J.L., K.J. and Z.Z.; formal analysis, J.L.; investigation, H.J.; resources, S.O.; data curation, J.L.; writing—original draft preparation, K.J.; writing —review and editing, J.L.; visualization, H.J.; supervision, H.J.; project administration, H.J.; funding acquisition, H.J. All authors have read and agreed to the published version of the manuscript.
Conflicts of Interest
The authors declare no conflict of interest.
Acknowledgements
This research was conducted with the support of the Ministry of Interior and Safety's Disaster Safety Department collaboration project. (Project Number: 20008820), This project is the result of a local government-university cooperation-based regional innovation project conducted with the support of the Korea Research Foundation with financial resources from the Ministry of Education in 2023. (2021RIS-001)