Assessment of Fire Model Uncertainty of Fire Dynamics Simulator in Multiple Compartments of Nuclear Power Plant
Article information
Abstract
It is necessary to consider the uncertainty of a fire model to ensure accuracy in fire risk assessment. Recently, NUREG-1824 reported fire model uncertainty data based on 340 full-scale fire experiment results. However, somewhat inaccurate test results can be obtained when the statistical uncertainty of the model is applied to specific fire risk assessments. In this study, the uncertainty of the fire model, Fire Dynamics Simulator (FDS), was investigated based on PRISME3 fire experiment results. Measurement and prediction results for approximately 200 locations were compared and analyzed, and the quantitative model uncertainty was calculated using the bias factor and relative standard deviation. The results showed that although the computed FDS bias factor of the heat flux based on NUREG-1824 test results was 0.89, 1.18 was obtained in this study, indicating a significant difference. Although the model uncertainties for the same fire experiment results were reviewed, a maximum difference of 12% in model uncertainty was observed, depending on the measurement location.
1. Introduction
For the efficient safety design of fire risk assessment and response systems of buildings, fire modeling based on Computational Fluid Dynamics (CFD) is increasing. In particular, nuclear power plant (NPP) fires cause reactor shutdowns and may damage major equipment related to safe stop or accident mitigation functions. Moreover, because such fires have the potential risk of causing severe accidents, such as radioactive leaks [1], fire risk assessments based on fire modeling are conducted systematically [2]. Recently, starting with NFPA 805 [3], the U.S. Nuclear Regulatory Commission (NRC) and the Electric Power Research Institute (EPRI) presented a fire modeling application standard for NPP fire risk assessment, publishing a fire modeling code application guide (NUREG- 1934) [4] and a fire model verification and validation guide (NUREG-1824) [5]. In Korea, a NUREG-1934 based fire modeling application guideline report [6-8] has been published by the Korean Institute of Nuclear Safety (KINS).
To evaluate the uncertainty of various fire models used for fire risk assessment, NUREG-1824 conducted fire modeling on 340 full-scale fire experiment results [5]. Bias factors (δ) and relative standard deviations (
To verify the reliability of fire risk assessments to which numerical analysis results of fire modeling have been applied, many researchers have compared and verified full-scale fire experiment and fire modeling results [12-14]. Nonetheless, the fire modeling application validity and quantitative assessment of fire risks might vary significantly, depending on the considered fire scenario, fire type, and user competencies [9]. The suitability and accuracy of an NPP fire model may be assessed by comparing it with full-scale fire experiment results obtained under similar compartmentalization and fire conditions. Recently, NPP fire modeling results were verified through the OECD/NEA international joint research project, Propagation d'un Incendie pour Scénarios Multi-locaux Élémentaires (PRISME) [15]. PRISME was developed by the Institute for Radiological Protection and Nuclear Safety (IRSN, by its acronym in French) in France. The project aims to experimentally analyze the propagation of various NPP full-scale fires. Many studies have been conducted to examine the suitability and accuracy of fire modeling using PRISME's fire experiment results [16,17].
In this study, the statistical model uncertainty suggested by NUREG-1824 through fire modeling and the model uncertainty confirmed through specific experimental results are compared and analyzed. PRISME3 S3_B0 was selected as the fire experiment condition, and fire modeling was conducted using Fire Dynamics Simulator (FDS version 6.7.0) as the fire model. The uncertainties of the NUREG-1824 model and model verified using PRISME3 S3_B0 [18,19] were compared. It was quantitatively confirmed that the model uncertainty changed with the physical quantities and prediction locations.
2. Review of Fire Model Uncertainty
Numerical analysis results obtained using various fire models applied to fire risk assessment and fire research include the uncertainty of each model. The uncertainties of fire models are caused by the inexactitude of numerical models and simplification processes used to formulate complex chemical reactions of real fires, thermal decompositions, and flame behaviors. The uncertainty of a fire model can significantly impact quantitative risk assessments conducted using fire modeling. NUREG-1824, which included fire model verification and validation results, presented fire model uncertainty results based on 26 full-scale fire experiments in 2007 [20]. In 2015, NUREG- 1824 presented more detailed model uncertainty information based on 340 full-scale fire experiment results [5]. In NUREG-1824, in order to numerically express the prediction uncertainty of the fire model, various physical quantities that can be measured and predicted in a fire experiment and simulation were compared.
The bias factor(δ) and relative standard deviation(
where
In this study, FDS [20,21], a representative field model selected among the numerous fire models presented in NUREG-1824, was used to conduct fire modeling on PRISME3 Smoke, Stratification, and Spread (S3). The Deardorff model was applied to analyze the subgrid turbulent flow in FDS. For combustion, the concept of being controlled by a characteristic mixing time assuming that the fuel-air reaction is infinitely rapid was set. Furthermore, the efficient mass fraction was predicted through lumped species that did not consider any individual species equation.
3. Description of Experiment and Simulation
3.1 Geometry of multiple compartments in nuclear power plant
PRISME3 S3_B0 was selected as the fire experiment condition for the fire model uncertainty in this study. PRISME3 S3_B0 was conducted in a space connected by three sections with an internal volume of 4.9 m (x) × 5.9 m (y) × 3.9 m (z) and an o pen door w ith a size of 0 .8 m (y) × 2 .1 m (z) (Figure 1(a)). The sidewall, floor, and ceiling inside the compartments were made of 0.3 m thick reinforced concrete, and the ceiling was insulated by a 0.05 m thick rock wool panel. The forced ventilation system set inside the compartments was one inlet duct in the fire room (R1), one inlet and one outlet duct in the adjacent room (R2), and one inlet duct in R3 (Figures 1(a) and 1(b)). The ventilation flow was supplied and exhausted in the x-axis direction. The physical quantities measured in real time to analyze the heat and smoke propagation mechanism under these compartment interior conditions for the liquid pool fire were pressure, gas temperature, wall temperature, heat flux, ventilation flow, and concentrations of O2, CO2, and CO. A total of 318 physical quantity measurement devices were installed in the compartments, open doors, and ventilation ducts. Figure 1(b) shows the location of each measurement device. The measured physical quantities were compared with the FDS predicted values and analyzed to determine the fire model uncertainty.
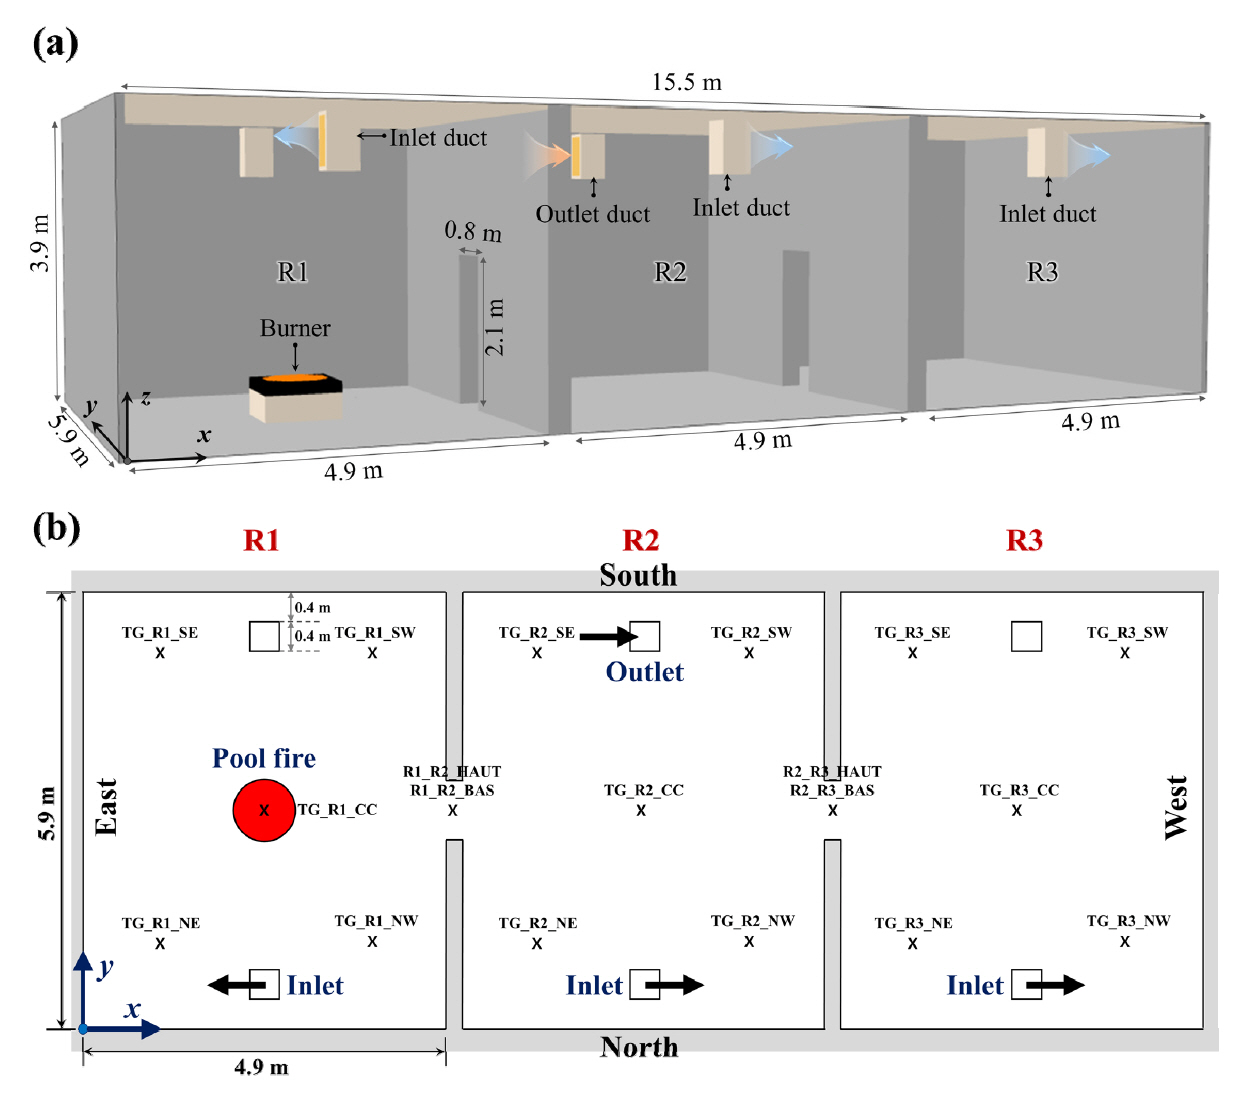
DIVA facility and measurement points for PRISME3 S3_B0 test.
3.2 Ventilation system
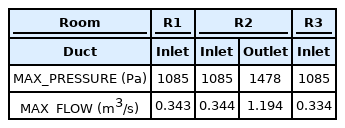
Figure 2 shows the pressure and ventilation flow data measured in the PRISME3 S3_B0 fire room in real time. Figure 2(a) shows the pressure data measured inside compartments and at the inlets and outlets of the ventilation ducts. The initial pressure inside the compartments was maintained at approximately -90 Pa before the liquid pool fire started. However, after the fire commenced, the pressure sharply increased to approximately 700 Pa. Although the initial set flow of all inlet ducts was 0.34 m3/s, it decreased to 0.23 m3/s shortly after the fire started. For the outlet ducts, the initial set flow rate was approximately 1.00 m3/s, and it increased to a maximum value of 1.31 m3/s as the fire progressed.

Measured static pressures and volume flow rates during PRISME3 S3_B0 test.
Two methods are used to set a ventilation system in the FDS fire model: VENT and HVAC options. Recently, FDS proposed an HVAC quadratic fan curve model that exhibits excellent predictive performance with minimal information regarding the ventilation system. The quadratic fan curve model defines the relationship between pressure and ventilation flow as expressed by Eq. (4):
where
Input Parameters used in Applying Quadratic Fan Curve Model
3.3 Fire source
Liquid n-dodecane (hydrogenated tetra propylene (HTP), C12H26) was selected as the fuel applied to PRISME3 S3_B0. A circular pan with an area of 0.56 m2 was placed on the top of the mass measurement system, which was located at a height of 0.35 m from the central floor of the fire room (R1). 56 L of fuel were initially supplied to the circular pan. Figure 3 shows the mass measured in real time using the mass measurement system. The mass loss rate can be calculated using the fuel mass measured in real time, and the fuel mass loss rate calculated in the fire experiment can be used as an input parameter for fire source modeling.
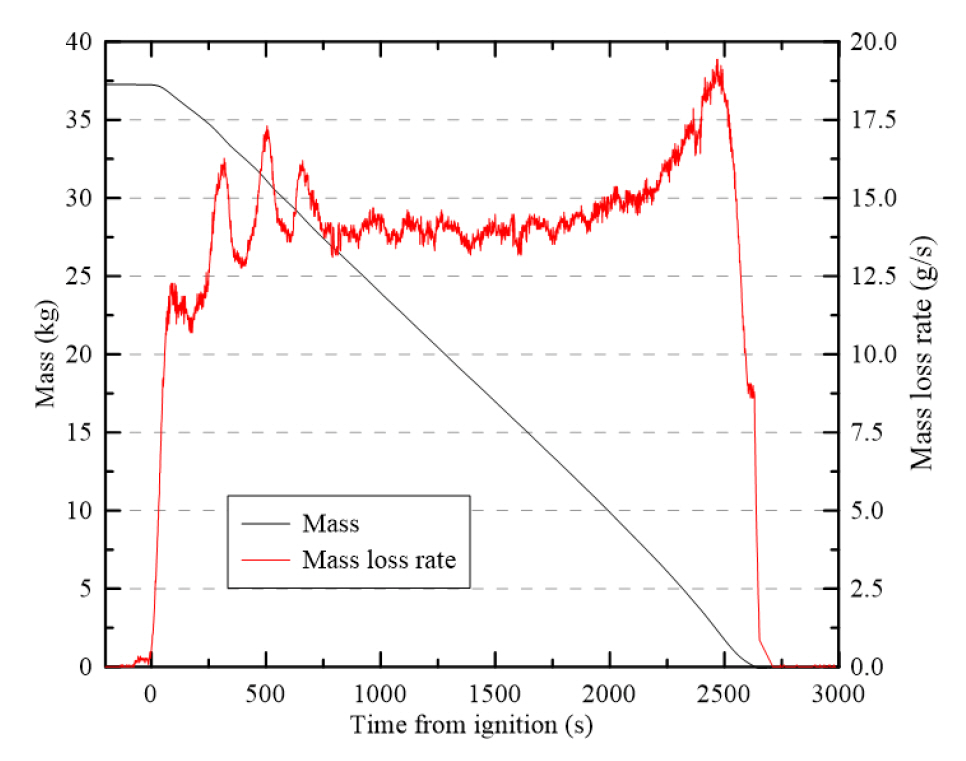
Measured fuel mass and calculated mass loss rate values in PRISME3 S3_B0 test.
The calculated fuel mass loss rate (Figure 3) can be used to determine the heat release rate (Q) using Eq. (5):
where
3.4 Grid sensitivity analysis
For numerical solution accuracy, the grid size setting should be considered a priority when conducting fire modeling using a large eddy simulation (LES) applied FDS. In an LES, the grid size does not only represent the area where numerical solutions are defined in a discontinuous local space; it is also directly related to the length scale for spatial filtering, turbulence, and combustion dependency of the model. Recently, the grid size is selected based on the number of grids that can be included in the fire characteristic diameter (D*) through experience. The method for computing the fire characteristic diameter is expressed by Eq. (6):
where
Figure 4 shows the results of the stepwise grid sensitivity analysis conducted for grid size selection before evaluating the uncertainty of the PRISME3 S3_B0 based fire model. Figures 4(a) and 4(b) show comparisons of the predicted numerical results based on the grid size at locations with the same gas temperature as near the floor and ceiling and the measured results obtained during the PRISME3 S3_B0 fire experiment. For the measured and predicted gas temperatures near the ceiling, the predicted and experimental values at

Grid sensitivity analysis through comparison of gas temperatures in R1.
4. Results and Discussion
Generally, when analyzing the fire model prediction performance, thermal physical quantities measured and predicted over time should be compared directly. However, as comparison and analysis are difficult to conduct when numerous measurement and prediction points exist, specific locations were selected to compare the test and simulation results. This approach might generate somewhat biased assessment results and decreased accuracy of the model uncertainty.
In this study, fire modeling was conducted using FDS based on PRISME3 S3_B0 fire experiment results to analyze the statistical uncertainty of the model proposed in NUREG-1824. In PRISME3 S3_B0, 318 different physical quantity measurement devices were installed to analyze heat and smoke propagation mechanisms through multiple compartment open doors and examine the liquid pool fire. Three thousand and three hundred data measured in one-second intervals from -300 to 3000 s were averaged in intervals of 100 s and reduced to 33 data to analyze the results more efficiently. The gas temperature, wall temperature, heat flux, and concentrations of O2, CO2, and CO were selected as physical quantities to examine the uncertainty of the fire model in PRISME3 S3_B0, and the measurement points of each physical quantity were assessed. The data were averaged in intervals of 100 s because the maximum interval at which the match rate of raw and averaged data was maintained at more than 99% was approximately 100 s.
Figure 5 shows comparisons of the fire modeling predicted and measured results for 134 points for gas temperature measurements during the PRISME3 S3_B0 fire. The δ and
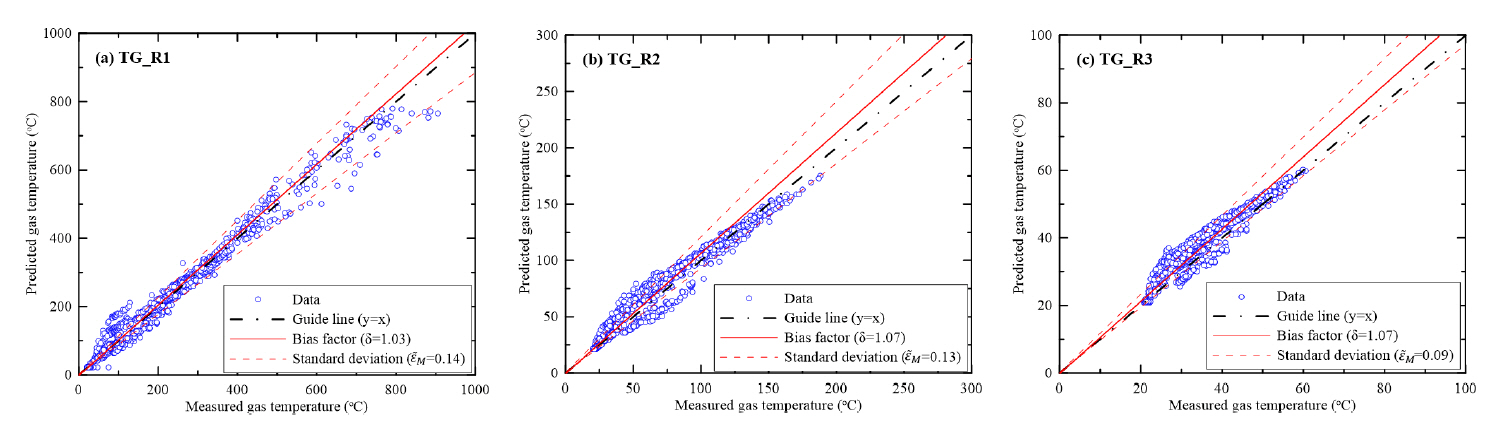
Comparisons between measured and predicted gas temperatures in PRISME3 S3_B0 test.
Figure 6 shows comparisons between the measured and predicted results for 12 points set for wall temperature measurements during the PRISME3 S3_B0 fire experiment. The measurement uncertainty of the wall temperature was 7%, and this value was used to calculate the δ and

Comparisons between measured and predicted wall temperatures in PRISME3 S3_B0 test.
Figure 7 compares and analyzes the measurement results for R1 and R3 in R1 and R3 from the 14 points set for heat flux measurement in the fire experiment and the predicted results of fire modeling. In Figures 7-9, only results measured and predicted for R1 and R3 are presented. The measurement of hear flux presented in the NUREG report was 11%, and it was used to assess the uncertainty of the fire model. The heat flux values predicted for four points in fire room (R1) were underpredicted at relatively low values and overpredicted at relatively high values (Figure 7(a)). In terms of the uncertainty of the model, the δ and
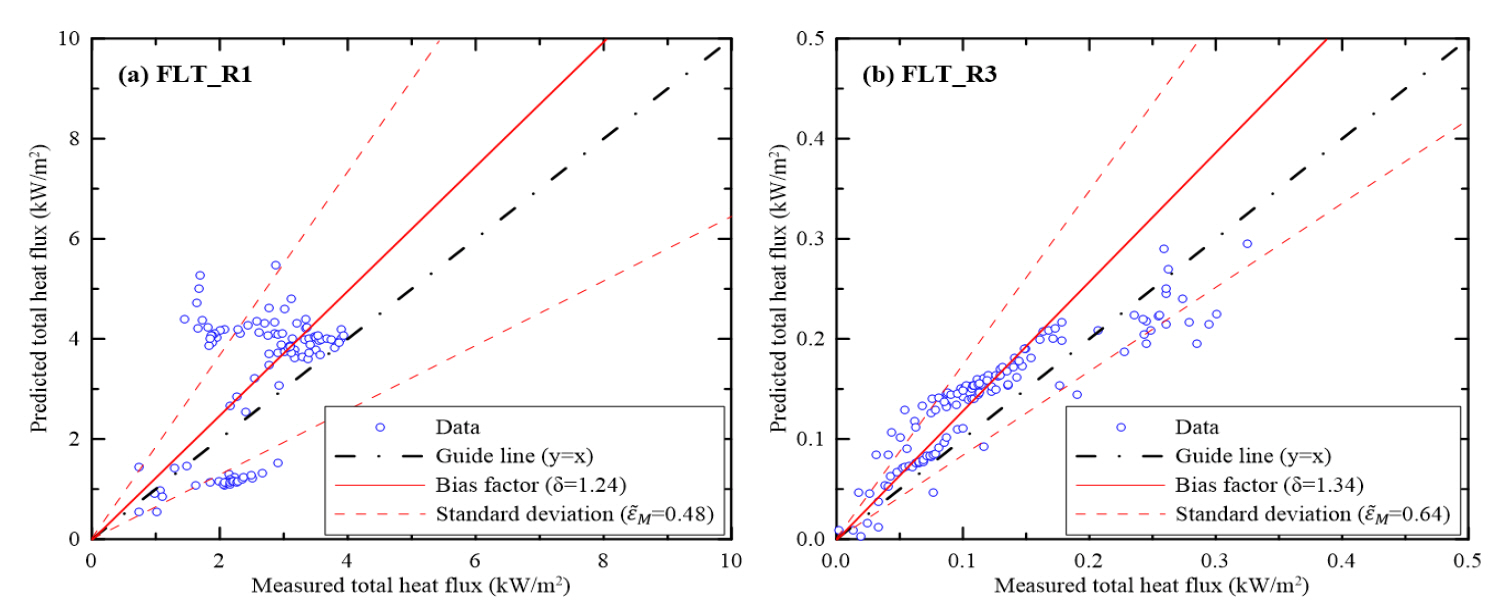
Comparisons between measured and predicted total heat fluxes in PRISME3 S3_B0 test.
Comparisons between measured and predicted O2 concentrations in PRISME3 S3_B0 test.
Comparisons between measured and predicted CO2 and CO concentrations in PRISME3 S3_B0 test.
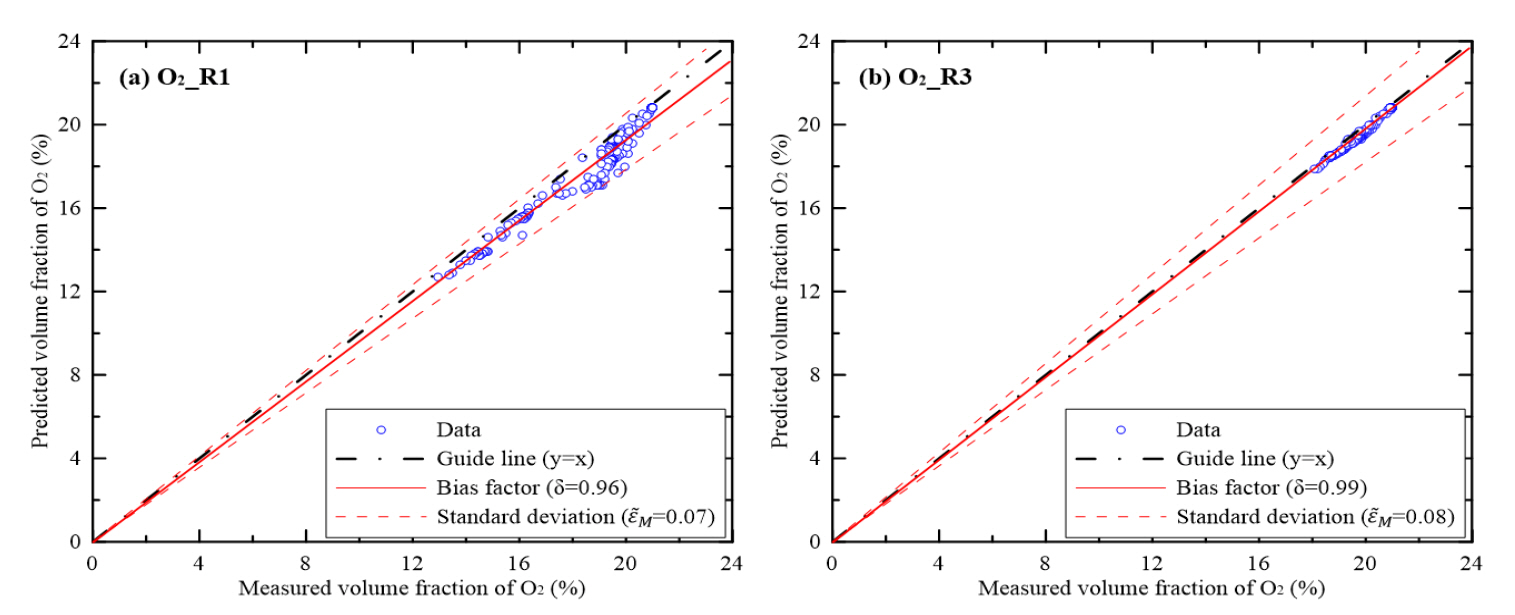
Figure 8 shows a comparison between the fire modeling prediction results and the measured results for R1 and R3 from 11 points set for O2 concentration measurements during the fire experiment. The uncertainty of the gas analyzer measurement based on NUREG-1824 and NUREG/CR-6905 was 8%. The predicted O2 concentrations for R1 was consistent with the O2 concentrations measured during the fire experiment (Figure 8(a)). The δ value (0.96) obtained using the FDS indicated an underprediction of 4%, and the
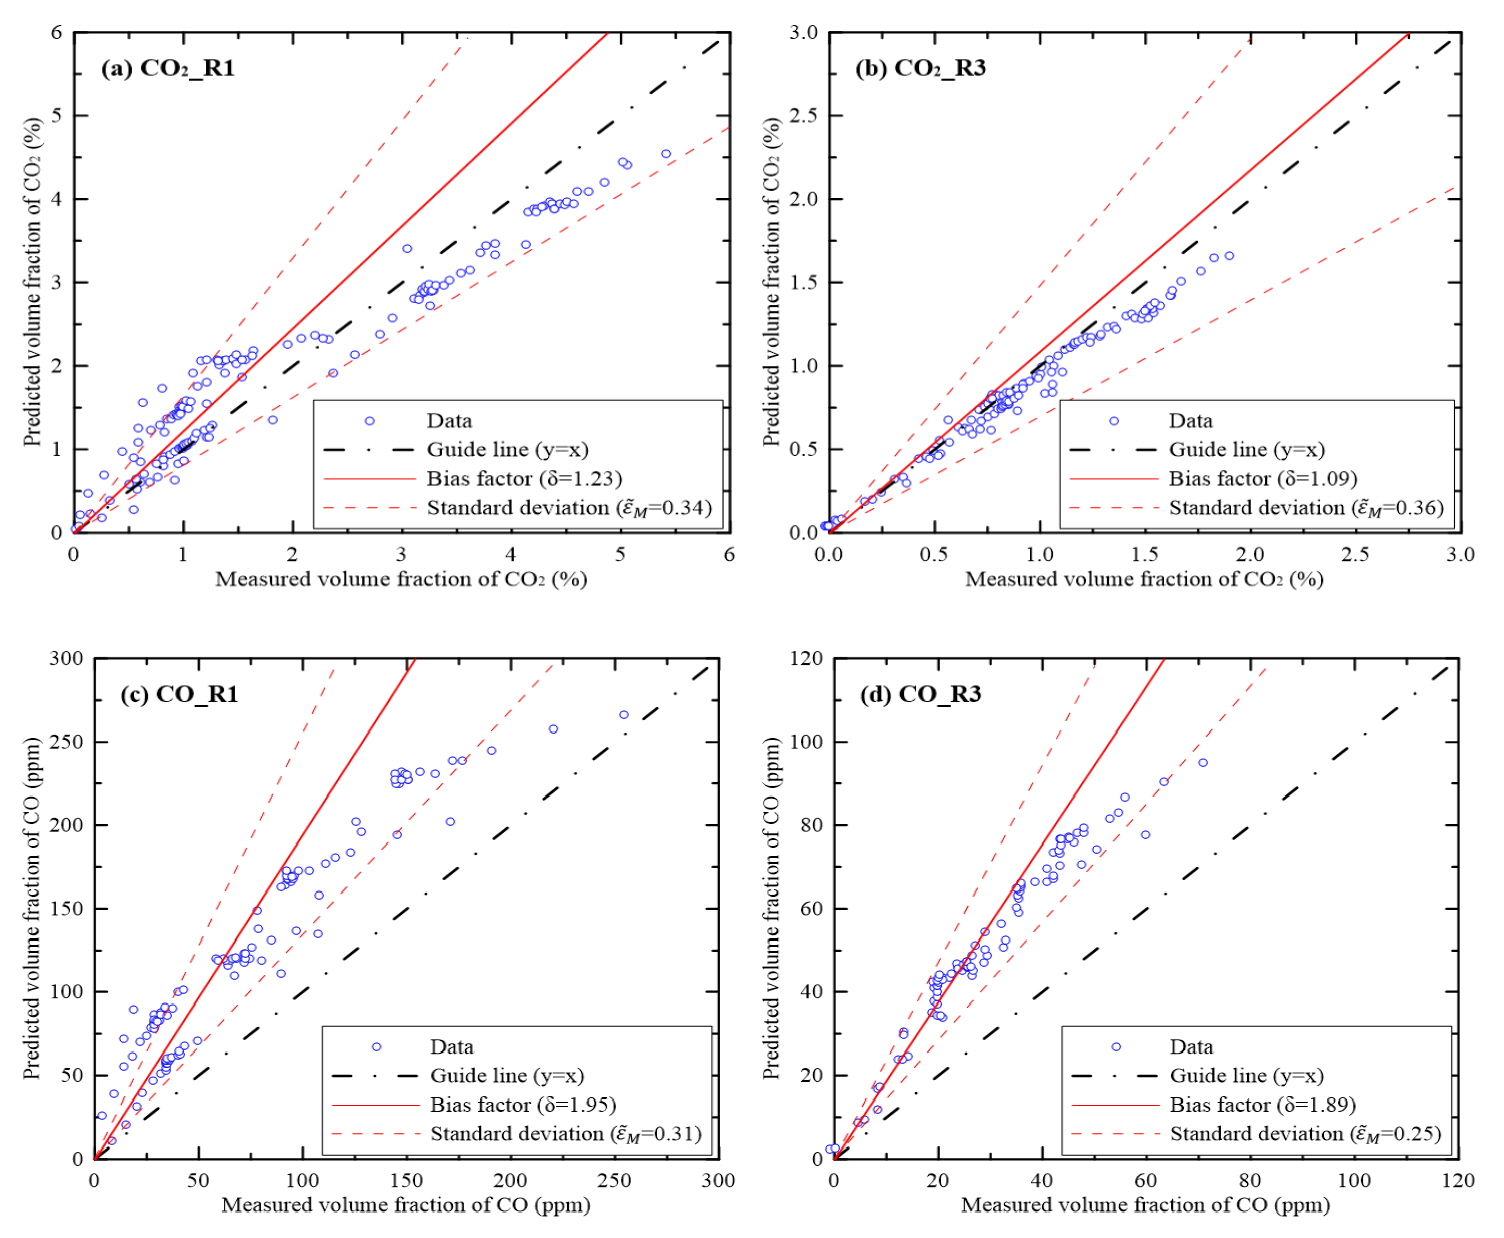
Figure 9 shows the prediction results based on data measured in R1 and R3 at 11 points set for CO2 and CO concentration measurements. The uncertainty of the CO2 and CO concentration measurements was set to 8%, similar to that for the O2 concentration. A somewhat significant difference in the CO2 concentrations between the measured and predicted values was observed. In this case, the δ and
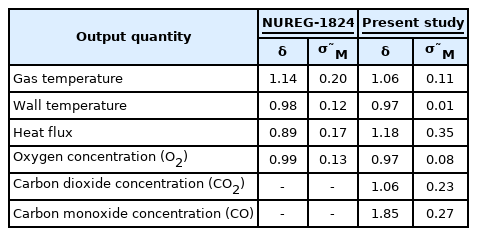
Table 2 presents a comparison between the FDS uncertainty of the fire model proposed in NUREG-1824 for each physical quantity and the uncertainty of the model verified for the PRISME3 S3_B0 fire experiment. Here, all measurement points installed in R1, R2, and R3 were considered for the δ and
Comparison between Validation Results of FDS in NUREG-1824 and this Study
5. Conclusion
In this study, the model uncertainty of a statistically calculated fire model was analyzed and compared with those of various full-scale fire experiments presented in NUREG-1824. FDS based fire simulations were conducted based on PRISME S3_B0 fire experiment results. From 318 points set for measurements of various physical quantities, results for 193 points of the gas temperature, wall temperature, heat flux, and species concentration were used to analyze the uncertainty of the model. The main conclusions of this study are as follows.
A comparison between the uncertainty of the model developed in this study and that of the FDS model presented in NUREG-1824 was conducted. First, model uncertainties of 8% and 1% were observed for the gas temperature and wall temperature, respectively. For the heat flux, a significant difference between the δ value presented in NUREG-1824 (0.89) and the value obtained in this study (1.18) was observed. The model uncertainty of the O2 concentration was approximately 2%. Although CO2 and CO concentrations are not presented in NUREG-1824, the model uncertainties of their δ values obtained in this study were 1.06 and 1.85, respectively.
Although NUREG-1824 suggests statistical model uncertaint based on the results of about 340 full-scale fire tests, a significant model uncertainty difference might occur, depending on the fire type and scenario. In addition, to this, it was confirmed through this study that the model uncertainty may vary depending on the installation location of the physical quantity measured device even with the same fire experimental result. Furthermore, when conducting fire modeling for model uncertainty assessment, caution must be applied because various factors, such as the user's competencies and the measurement uncertainty of input parameters, can influence the predicted results. A systematic model uncertainty appropriate to fire modeling conditions may be required to minimize such problems by considering factors that can significantly influence the assessment of model uncertainty.
Notes
Author Contributions
Conceptualization, C.H.H. and S.K.L.; methodology, C.H.H. and H.S.H.; software, H.S.H.; validation, H.S.H.; formal analysis, H.S.H. and J.H.L.; investigation, C.H.H.; data curation, H.S.H.; writing―original draft preparation, H.S.H.; writing―review and editing, C.H.H.; visualization, H.S.H.; project administration, S.K.L. and J.H.L.; funding acquisition, S.K.L. and J.H.L. All the authors have read and accepted the published version of the manuscript.
Conflict of Interest
The authors declare no conflict of interest.
Acknowledgements
This study was supported by the Nuclear Safety Research Program through the Korea Foundation of Nuclear Safety (KOFONS) using the financial resource granted by the Nuclear Safety and Security Commission (NSSC) of the Republic of Korea (No. 1705002).