Analysis of Ultrasonic Pulse Velocity Correlations for Estimating Residual Compressive Strength of Concrete Subjected to High-Temperature Hysteresis: Influence of Various Aggregates
Article information
Abstract
In this study, the compressive strength and ultrasonic pulse velocity (UPV) behaviors of concrete at high temperatures by aggregate type were comparatively analyzed in accordance with the CEN and CEB Codes. The aggregates adopted were divided into limestone, granite, river gravel, and crushed stone, and the target temperatures were set to 100 °C, 200 °C, 300 °C, 400 °C, 500 °C, and 600 °C. The analysis items were specified as compressive strength (Fc), UPV, ratio of compressive strength (Fcratio), and UPV ratio (UPVratio); in addition, the correlations between Fcratio and UPV were analyzed and compared to the previously proposed estimation equations for concrete at room temperature. Accordingly, the Fcratio of limestone and river gravel aggregates exceeded the UPVratio at temperatures lower than 300-400 °C; however, UPVratio tended to be higher at subsequent temperatures. For granite aggregates, UPVratio was higher than Fcratio over the entire temperature range, while crushed stone aggregates exhibited higher Fcratio than UPVratio. Both Fcratio and UPVratio of granite aggregates exceeded those of limestone aggregates, while the UPVratio and Fcratio of river gravel aggregates were higher and lower than those of crushed stone aggregates, respectively. Consequently, a strength estimation equation was proposed by analyzing the correlations between Fcratio and UPV, and was inferred to be better than the existing strength estimation equations.
1. Introduction
The number of fires and amount of property damage to buildings have been increasing annually as the height and density of buildings increase [1]. The safety evaluation of buildings after a fire is a very important aspect because these buildings need to be assessed for the safety of occupants or for their reuse. Among the safety evaluation methods, non-destructive testing (NDT) methods are widely adopted in the field to compensate for the limitations of destructive measurement methods by acquiring samples that can damage existing fire- damaged buildings. Among them, the ultrasonic pulse velocity (UPV)-based technology applied in the fields of metals, alloys, and composite materials, is considered beneficial in measuring the strength and safety of concrete owing to its non-destructive nature and convenience [2].
The compressive strength (Fc) of concrete is a crucial mechanical element in evaluating the safety of buildings, and studies have previously been conducted on estimating the Fc of concrete via UPV analysis [3]. Aggregates, which account for 70% of concrete, and small voids formed between aggregates and mortar significantly influence both the UPV and Fc [4]. Therefore, it is important to investigate the changes and relationship between Fc and UPV, according to factors such as the type, size, and surface roughness of aggregates. Mohamed analyzed the relationship between UPV and Fc by aggregate type, including black stone, round stone, crushed stone, and brick fragments, and confirmed that UPV increased with the aggregate size [3]. Gucluer et al. confirmed that, as the surface roughness of aggregates increased, the Fc increased owing to a stronger interfacial transition zone (ITZ); in addition, an increase in UPV was observed [4]. Crawford et al. confirmed that a higher aggregate amount resulted in a higher UPV value at the same strength [5]. Trtnik et al. confirmed that UPV increased with the size of aggregates in contrast to the increase in Fc of smaller aggregates, and the UPV of round aggregates was deduced to be higher, while the Fc was lower than those of angular aggregates [6].
However, concrete exposed to high temperatures experiences microcracks inside the concrete owing to the shrinkage of the cement paste and expansion of the aggregate, which in turn reduces the density, Fc, and UPV. In particular, UPV is severely affected by microcracks resulting from the weakening ITZ as the temperature increases [7]. Coarse aggregates vary in their thermal expansion rate by type, and it has been reported that the understanding of thermal properties at high temperatures depending on the type of aggregates is crucial [8]. Generally, at temperatures lower than 300 °C, the Fc slightly increases with the evaporation of moisture in cement and the rehydration of cement particles. Even if the Fc remains the same or decreases, it does so solely to the degree that does not adversely affect the safety of concrete. However, at temperatures higher than 300 °C, the dehydration of Ca(OH)2 occurs, and the C-S-H decomposition accelerates, which causes the strength to start decreasing, especially rapidly after the 400-500 °C range [9,10]. Therefore, via UPV analysis, research has been conducted to estimate the mechanical properties at high temperatures, depending on the materials mixed in cement, including aggregates and admixtures, and the mechanical properties. Accordingly, several researchers have proposed numerous estimation equations based on the relationship between Fc and UPV [11-22].
Although researchers have previously investigated the effects of the type and shape of coarse aggregates on strength and UPV, the research conducted on the effects at high temperatures is insufficient. Particularly, in previous studies, only the correlation between the Fc (MPa) and UPV (km/s) or the residual strength ratio and the residual UPV ratio were analyzed, while the prediction of strength via UPV, over the entire strength range after a fire, tends to be relatively less reliable.
The objective of this study is to improve reliability in evaluating the residual Fc of fire-damaged buildings via UPV over the entire strength range by analyzing the correlation between the residual compressive strength ratio (Fcratio) and UPV. As the analysis scope of this study, aggregates were classified into limestone, granite, river gravel, and crushed stone; in addition, factors related to UPV were analyzed according to the type and shape of aggregates by comparing the Fcratio and UPV ratio (UPVratio). Ultimately, a statistical estimation equation was proposed by systematically analyzing the correlation between UPV and the compressive strength of concrete subjected to high temperatures for each aggregate type.
2. Analysis Method and Purpose
2.1 Analysis method
In this study, influential factors such as Fc, target temperature, heating rate, and W/B of concrete were classified to analyze key previous studies on the UPV of concrete subjected to high temperatures depending on the aggregate type. The details of this analysis are summarized in Table 1. The aggregates employed in the analysis were specified into four types (limestone, granite, river gravel, and crushed stone).
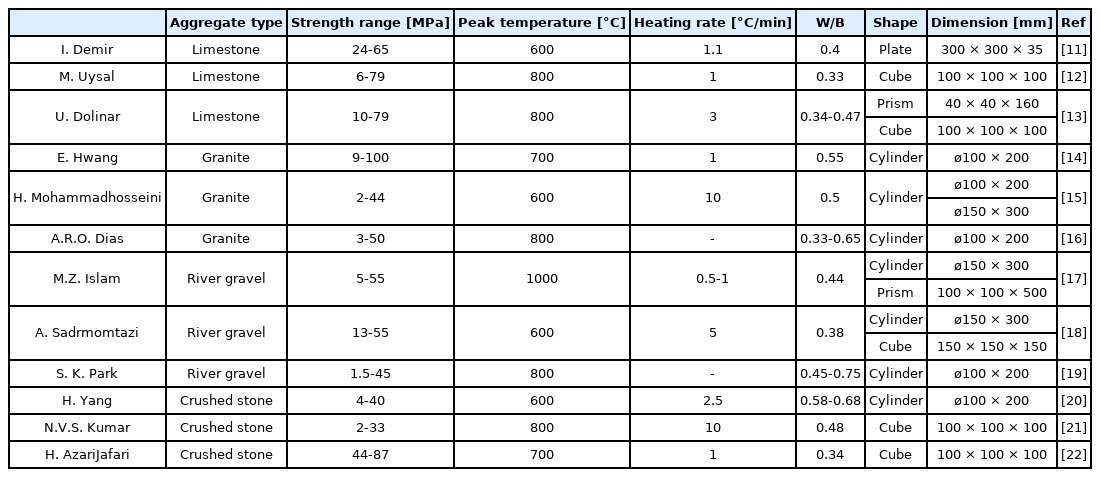
UPV Analysis Range for Concrete on Elevated Temperature
2.1.1 Studies on concrete with limestone aggregates
Demir et al. [11] prepared plate specimens and measured UPV after heating them at the heating rate of 11 °C/min and cooling them at 1.1 ℃/min. Subsequently, they were exposed for 3 h to reach the target temperature. Uysal et al. [12] prepared cube specimens and maintained the heating rate at 1 °C/min to reach the target temperature in a heating furnace for 3 h, and then cooled them at a cooling rate of 0.4 °C/min, before measuring UPV. Dolinar et al. [13] prepared large and small prism specimens with W/C values of 0.34 and 0.47, respectively, and further cut the large specimen into cube specimens. UPV was measured after heating the specimens at the rate of 3 °C/min, before cooling them at room temperature.
2.1.2 Studies on concrete with granite aggregates
Hwang et al. [14] heated specimens at a set heating rate of 1 °C/min via a load test. The difference in temperature between the inside and the surface of the specimens was maintained to be within 5 °C. Mohamm Adhosseini et al. [15] prepared cylindrical specimens with different diameters and heights, which were heated at the heating rate of 10 °C/min and cooled down at room temperature, followed by the ultrasonic pulse measurement. Dias et al. [16] prepared cylindrical specimens, which were dried in a heating furnace at 105 °C, heated, and then cooled in water and air before measuring the ultrasonic pulse.
2.1.3 Studies on concrete with river gravel aggregates
After preparing cylindrical and prism specimens, Islam, et al. [17] prepared cylindrical and prism specimens, heated them at a heating rates of 0.5-1 °C/min, slowly cooled them at room temperature, and then measured ultrasonic waves. Sadrmomtazi et al. [18] prepared cylindrical and cube specimens, which were heated at a heating rate of 5 °C/min and maintained for 2 h at the set temperature; subsequently, UPV was measured after cooling the specimens at room temperature. S. K. Park et al. [19] prepared specimens with W/C values of 0.45, 0.6, and 0.75, left them in a heating furnace for 24 h, cooled them slowly, and then measured them via UPV.
2.1.4 Studies on concrete with crushed stone aggregates
Yang et al. [20] prepared cylindrical specimens with W/C value of 0.58 and 0.68, heated them at a heating rate of 2.5 °C/min, cooled them at room temperature, and measured the ultrasonic pulse. Kumar et al. [21] prepared cube specimens, which were heated at a heating rate of 10 °C/min and maintained at the target temperature for 2 h. After 24 h of slow cooling, the ultrasonic pulse was measured. Azari Jafari et al. [22] prepared cube specimens, which were heated at a heating rate of 1 °C/min and maintained for 1 h. Subsequently, the specimens were cooled at room temperature and the ultrasonic pulse was measured.
2.2 Analysis factors
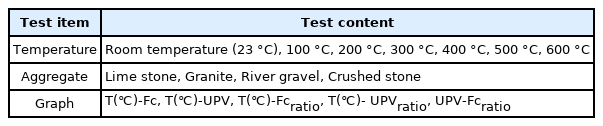
Table 2 provides comprehensive details on the factors analyzed in this study. The temperature was set to room temperature (23 °C), 100 °C, 200 °C, 300 °C, 400 °C, 500 °C, and 600 °C. At temperatures higher than 600 °C, the Fc and UPV decreased significantly and were excluded from the analysis, as they exhibited similar trends, regardless of the type of aggregates. The aggregates were classified into limestone, granite, river gravel, and crushed stone. The Fc, UPV, Fcratio, and UPVratio were analyzed at varying temperatures, which were then compared and analyzed in accordance with the CEN and CEB Codes. In addition, Fcratio and UPVratio were compared and analyzed by classifying the types (limestone, granite) and shapes (river gravel, crushed stone) of aggregates.
Analysis Factors
Finally, a strength estimation equation was proposed by analyzing the correlation between Fc and UPVratio for each type of aggregate and was compared to the existing strength estimation equations at room temperature.
3. Analysis Results
3.1 Compressive strength and UPV behaviors by aggregate type at high temperatures
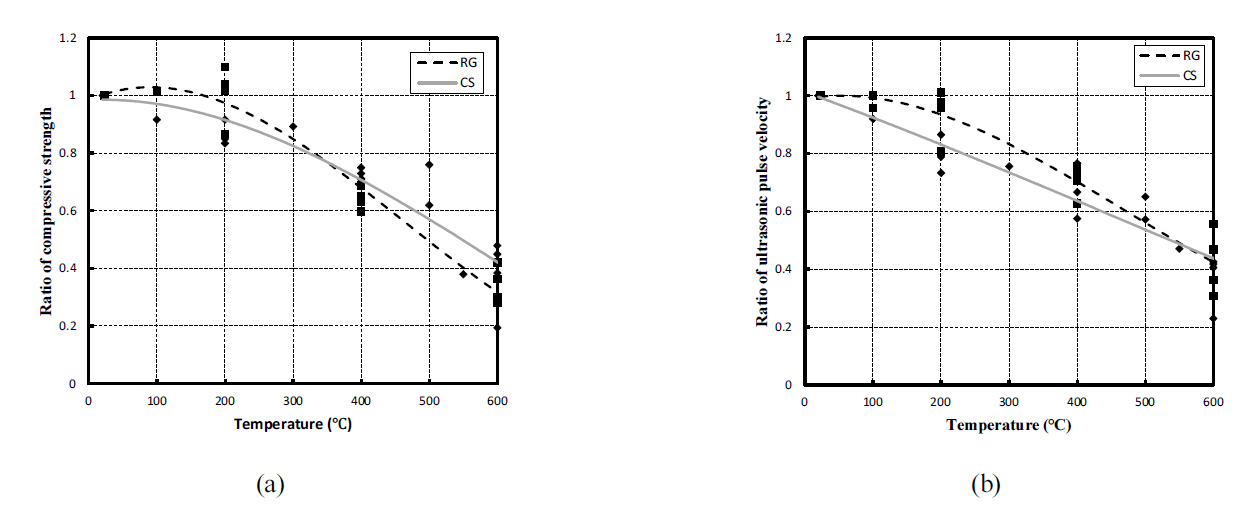
Figure 1 presents the Fc and UPV values at high temperatures derived in previous studies according to the type of coarse aggregates mixed in concrete. There were divided into four types: limestone, granite, river gravel, and crushed stone. Figure 1(a) presents the experimental Fc values depending on the type of coarse aggregate at high temperatures, and indicated that the strength decreased at 100 °C in all cases. The strength increased at temperatures up to 300 °C but decreased again in the range higher than 300 °C, and then continued to decrease at temperatures above 400 °C.
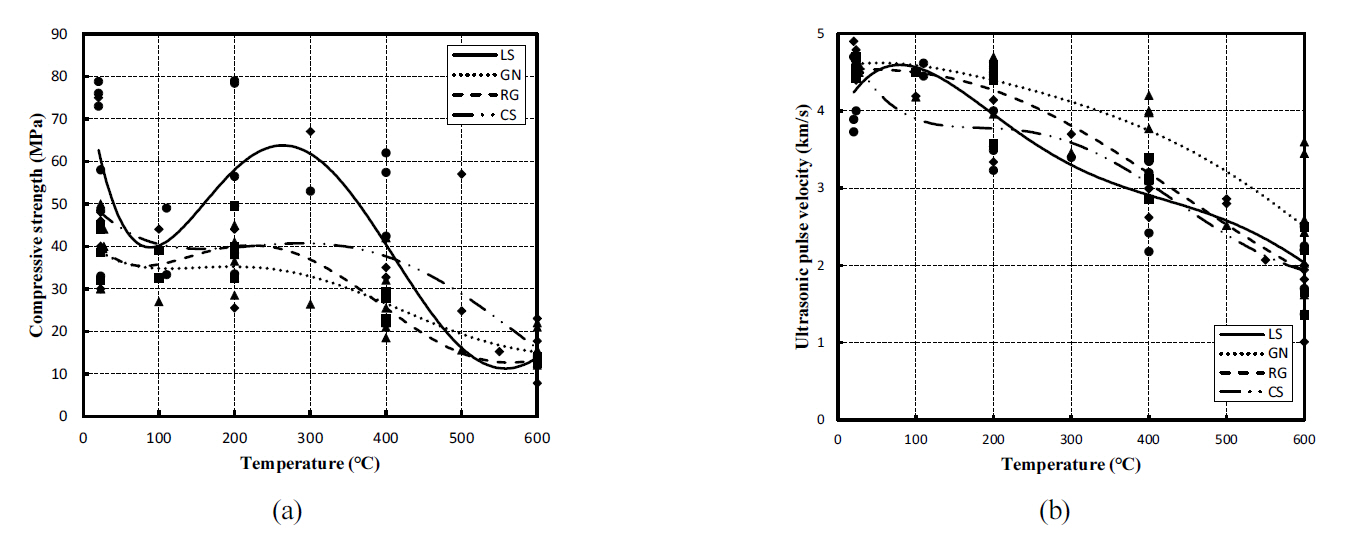
Variation in Fc and UPV values with high temperatures: (a) Fc; (b) UPV.
Figure 1(b) presents the experimental UPV values at high temperatures depending on the type of coarse aggregate. Excluding crushed stone, the trend in UPV at 100 °C is similar to that of UPV at room temperature or slightly higher. However, the UPV values tend to decrease continuously at temperatures above 100 °C. The UPVLS values exceed those of the other aggregates, while UPVSC starts decreasing at the initial temperature. However, at subsequent temperatures, the trend is similar to those of UPVLS and UPVRG.
3.2 Comparison and analysis of Fcratio and UPVratio by aggregate type at high temperatures
Figure 2 presents Fcratio and UPVratio values at varying temperatures by aggregate type in comparison to the CEN (siliceous) Code, CEN (calcareous) Code, and CEB Code. Figures 3(a) and 3(b) and 3(c) and 3(d) present the cases for limestone, granite, river gravel, and crushed stone, respectively.

High temperature Fcratio and UPVratio according to coarse aggregate: (a) limestone aggregate; (b) granite aggregate; (c) river gravel aggregate; (d) Crushed stone aggregate.

Fcratio and UPVratio at high temperatures according to type of coarse aggregate: (a) Fcratio; (b) UPVratio.
Table 3 summarizes the relationships between the temperature, Fcratio, and UPVratio presented in the graphs. Previous studies concluded that the temperature-Fcratio and temperature-UPVratio relationships were most suitably expressed in tertiary polynomials, and the relationships in this study were also expressed in tertiary polynomials [23].
Relationships between Fcratio and UPVratio on Elevated Temperatures
Regarding the limestone aggregate concrete (Figure 2(a)), the Fcratio values exceeded the UPVratio values by 6% on average at temperatures below 400 °C; however, on average, the UPVratio values were 12% higher than 400 °C. Although Fcratio was similar to that of the CEB Code below 400 °C, it was higher than 400 °C. UPVratio was lower at temperatures below 400 °C but higher over the subsequent temperature range, and both Fcratio and UPVratio were lower over the entire temperature range than those of the CEN Code.
For the granite aggregate concrete (Figure 2(b)), Fcratio and UPVratio were similar at temperatures up to 200 °C; however, on average, UPVratio tended to exceed Fcratio by 13% with the increasing temperature. In addition, the deviation increased as the temperature increased. Therefore, it is inferred that the evaluation of UPV for fire-damaged buildings constructed with granite aggregate concrete should be performed in a conservative manner.
Although the Fcratio and CEB Code were similar over the entire temperature range, UPV tended to exceed them at 200 °C or higher. In addition, UPVratio exceeded the CEN (C) Code, while Fcratio fell below it. The CEN (S) Code was exceeded at all temperatures.
Regarding the river gravel aggregate concrete (Figure 2(c)), on average, Fcratio tended to exceed UPVratio by 4% in the temperature range below 300 °C, while UPVratio tended to exceed Fcratio by 16% in the subsequent range. The Fcratio and CEB Code were similar at all temperatures, and UPVratio tended to exceed the CEB Code at temperatures above 350 °C. The CEN Code exceeded Fcratio and UPVratio at all temperatures above 300 °C.
Regarding the crushed stone aggregate concrete (Figure 2(d)), Fcratio exceeded UPVratio by 7% on average at all temperatures, where Fcratio and UPVratio exhibited similar trends as the temperature increased. Therefore, it is believed that residual strength may be slightly overestimated in the fire safety evaluation of buildings constructed with crushed stone aggregate concrete. Although both Fcratio and UPVratio values fell below the CEB Code at temperatures of 300 °C or lower, Fcratio was higher above 300 °C. UPVratio was higher at approximately 450 °C or higher. They all exhibited a lower trend than the CEN Code, while Fcratio exhibited a similar trend above 500 °C.
3.3 Comparison and analysis of Fcratio and UPVratio by aggregate type and shape at high temperatures
Figure 3 presents Fcratio and UPVratio of limestone and granite aggregates at different temperatures, respectively. The concrete mixed with granite aggregates was higher than the concrete mixed with limestone aggregates in both Fcratio and UPVratio at varying temperatures by 8% and 13% on average, respectively.
Severe cracks were formed in the concrete owing to the decarboxylation reaction of calcium carbonate in limestone aggregates at high temperatures, which is believed to have exerted a more significant effect on the reduction in strength and UPV [24]. The larger deviation in UPVratio compared to the deviation in Fcratio with the changing temperature is attributed to the higher sensitivity of UPV to cracks than Fc.
Figure 4 presents Fcratio and UPVratio of river gravel aggregates and crushed stone aggregates at varying temperature. At temperatures below 400 °C, the Fcratio of river gravel aggregate concrete exceeded 5% on average, while, on average, the Fcratio of crushed stone concrete was 17% higher at temperatures above 400 °C. This is because the river gravel aggregates with smooth surfaces and the paste form a weaker interface than the interface between the crushed stone aggregates with rough surfaces and the paste [25-28]. On average, the UPVratio of river gravel aggregates were 7% higher with the varying temperatures. In previous studies on the tendency of UPV by aggregate shape, UPV was relatively higher in concrete that contained aggregates with a round surface.
Fcratio and UPVratio at high temperatures according to shape of coarse aggregate: (a) Fcratio; (b) UPVratio.
3.4 Correlation between Fcratio and UPVratio at high temperatures
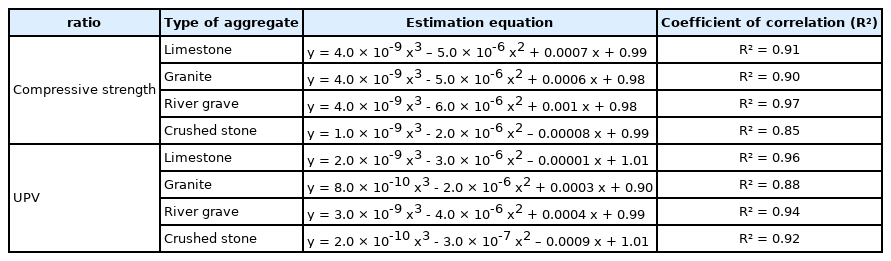
Figure 5 presents a graph illustrating the correlation between Fcratio and UPV. Existing strength estimation equations based on UPV at room temperature were proposed in the form of an exponential function; however, several equations based on UPV at high temperatures were proposed in the form of a primary function. Therefore, it was considered suitable to propose equations in the form of a primary function in this study; hence, the following strength estimation equations were proposed. Limestone aggregates exceeded granite aggregates over the entire UPV range, while crushed stone aggregates exceeded river grave aggregates over the entire UPV range. In the low UPV range, although river gravel aggregates fell below the other aggregates, they agreed well with the other aggregates in the high UPV range. Table 4 summarizes the equations and coefficients of correlation for all aggregates based on the Fcratio and UPV correlation graph.
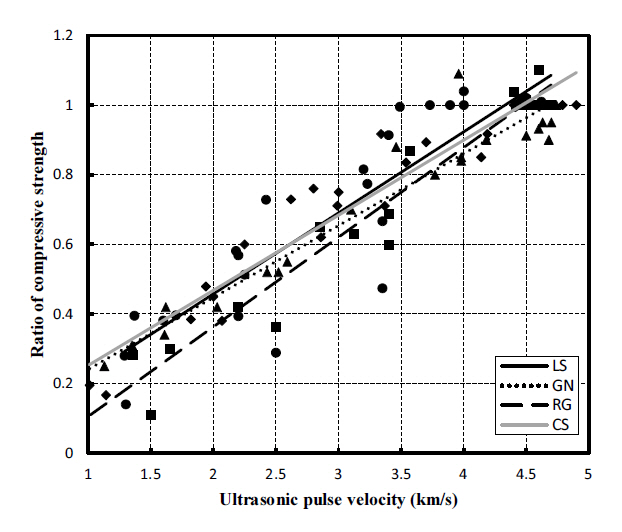
Relationship between Fcratio and UPVratio at high temperature according to coarse aggregate.
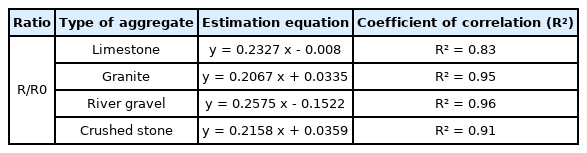
Estimation Equation and Correlation between UPV and Fcratio
Figure 6 presents a graph based on all the data analyzed in this study, and illustrates the comparison with the existing strength estimation models at room temperature [29-31]. In addition, the equations proposed in this study and the equations of the existing strength estimation models are summarized in Table 5.
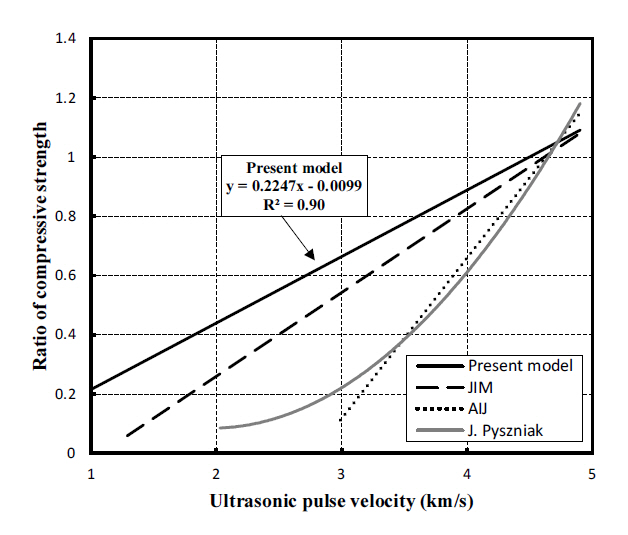
Comparison with other Fc prediction models.
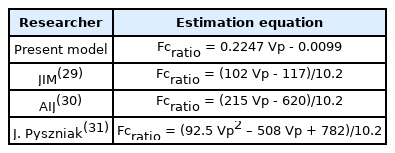
Estimation Equations of Previous Studies
Although river gravel aggregates differ from other aggregates in the low UPV range, because river gravel aggregates are generally less commonly used than crushed stone aggregates, this study proposed an equation for estimating the residual compressive strength of concrete via UPV at a single high temperature. The equation proposed in this study exhibited the smallest deviation from the JIM strength estimation model and a large deviation from all other strength estimation models. This is attributed to microcracks in concrete at high temperatures, which causes the residual compressive strength to be lower than concrete at room temperature given the same UPV.
4. Conclusion
In this study, the changes in Fc and UPV with temperature were analyzed by classifying the aggregate types into limestone, granite, river gravel, and crushed stone. In addition, a residual Fc estimation equation was proposed by analyzing the correlation between Fcratio and UPV, which was also compared and analyzed with the existing room-temperature strength estimation equations.
(1) In general, Fc slightly increased in the range of 100- 300 °C, decreased above 300 °C, and decreased even more rapidly at approximately 400 °C. In contrast, the UPV value continuously decreased as the temperature increased.
(2) On average, the Fcratio of limestone aggregates exceeded the UPVratio by 6% below 400 °C, while, on average, the UPVratio exceeded the Fcratio by 12% above 400 °C; however, the UPVratio of granite aggregates exceeded Fcratio by 13% on average at all temperatures. Regarding river gravel aggregates, Fcratio exceeded UPVratio by 4% on average below 300-400 °C, while UPVratio exceeded Fcratio by 16% in the subsequent temperature range, whereas the Fcratio of crushed stone aggregates exceeded UPVratio by 7% on average at all temperatures.
(3) Both Fcratio and UPVratio of granite aggregates exceeded those of limestone aggregates by 8% and 13%, respectively, which is attributed to the development of microcracks from the decarboxylation reaction of calcium carbonate in limestone aggregates. The Fcratio of crushed stone aggregates was on average 17% higher because the rough surface of the aggregates forms a strong interface with the paste while the UPVratio of river gravel aggregates was 7% higher owing to their round surfaces.
(4) In the correlation between Fcratio and UPVratio, the limestone aggregates exceeded granite aggregates, while the crushed stone aggregates exceeded river gravel aggregates. In the low UPV range, although river gravel aggregates tended to fall below other aggregates, they converged with them as UPV increased.
(5) In this study, an estimation model with an R2 value of 0.90 was proposed, which produces results that tend to exceed those of the existing room-temperature strength estimation models.
Notes
Author Contributions
Conceptualization, H.C. (Hyeonggil Choi) and T.L.; methodology, H.C. (Hyeonggil Choi); software, W.K.; validation, H.C. (Hyeonggil Choi), T.L. and H.C. (Heeyong Choi);formal analysis, W.K.; investigation, W.K.; resources, H.C. (Hyeonggil Choi); data curation, W.K.; writing―original draft preparation, W.K.; writing―review and editing, H.C. (Hyeonggil Choi); visualization, T.L.; supervision, H.C. (Hyeonggil Choi); project administration, T.L.; funding acquisition, H.C. (Heeyong Choi). All authors have read and agreed to the published version of the manuscript.
Conflict of Interest
The authors declare no conflict of interest.
Acknowledgements
This research was funded by the Korea Agency for Infrastructure Technology Advancement (KAIA) grant funded by the Korea government (MOLIT), grant number 22RITD- C162704-02.