
1. Introduction
Tunnels are constructed in mountainous terrains and under the seabed to overcome topographic limits and facilitate transportation and logistics movements. With the increasing demand for transportation and logistics movements owing to industrial development, the demand for tunnels that can facilitate traffic flow is increasing. For modes of transportation on land, automobiles and trains transport people and logistics through tunnels. In the case of road tunnels used by automobiles, the traffic volume is large, but this varies depending on time and conditions. However, the traffic volume in railway tunnels is regular, and the frequency of use of railway tunnels is lower than that of road tunnels because vehicles move only on fixed schedules. For this reason, road tunnel has a higher risk of fire than railway tunnel. In road tunnel, fire safety standards are used for installation standards, maintenance and safety management of firefighting facilities [1]. For railway tunnels, design and safety are verified based on the railway safety analysis results obtained according to the technical standards of railway facilities [2] and the safety analysis manuals for railway tunnels. The technical standards of railway facilities specify that scale-model tests and simulations should be conducted for tunnels with lengths exceeding one kilometer as safety analysis targets.
For road and railway tunnels, the maximum heat release rate for fire scenarios is designated, but no specific design guidelines have been developed for smoke control systems. Although transverse, longitudinal, and semitransverse ventilation systems are installed in road tunnels for ventilation and smoke control, no specific standards for railway tunnels have been considered. The tunnel design standards and ventilation design standards established by the Ministry of Land, Infrastructure and Transport present smoke control and ventilation. No specific standard on the wind speed for smoke control is available, but the airflow velocity in the tunnel must be 2.5 m/s or higher for the entry and exit of workers [3]. Based on this airflow velocity condition, systems that can maintain a wind speed of 2.5 m/s are designed and installed at construction sites.
In previous studies on railway vehicle fires, scale-model tests and fire simulation tests were conducted. Scale models have been mainly used to determine design values for fires and smoke properties by reducing the actual tunnel size using the similarity law. Park et al. [4] performed a design for a railway vehicle fire using a scale model. They used a methanol fire source and measured the critical velocity of the scale model via smoke visualization to overcome the shortcomings of conventional scale-model tests. Li et al. [5] conducted an experiment on the backlayer length and critical velocity using dimensionless numbers and two scale-model tunnels with different cross-sections. In their study, a relationship for the critical velocity was proposed using a dimensionless number, and it was shown that the dimensionless number converged to a particular value when the critical velocity increased, regardless of the heat release rate. A relationship was derived for the backlayer length based on the ratio between the jet fan flow rate and the critical velocity, and the corresponding dimensionless number was verified experimentally. Simulations were used to establish a full-scale model that is difficult to implement in experiments. Chen et al. [6] evaluated the critical velocity that can control smoke via a full-scale simulation by generating a flow in the tunnel direction and cross-passage space on the side of the tunnel. They derived critical velocity values to achieve safety by modeling under 28 conditions using the benefits of simulations. Tao et al. [7] investigated the performance of smoke control systems based on the size and location of the fire source in a 400-m-long railway tunnel via simulations. They also analyzed the changes in the fire and smoke behavior using mist and fire-extinguishing agents. Research on tunnel fire has been focused on determining the critical velocity based on the smoke behavior.
The critical velocity indicates the required performance of a smoke control system, and it is a critical factor for preventing smoke backlayering. It is necessary to correctly assess the critical velocity and the performance of the smoke control system during a tunnel design to prevent backlayering. As mentioned above, no specific guidelines are available for evaluating the performance of smoke control systems in tunnels. Therefore, an average flow velocity of 2.5 m/s has been used as a reference during the design of smoke control systems. In this study, an attempt was made to verify the validity of smoke control performance and identify backlayering characteristics based on the size and location of the fire source at an average flow velocity of 2.5 m/s.
2. Numerical Model and Conditions
2.1 Numerical model
Fire Dynamics Simulator ver. 6.7.5, a fire simulation software developed by the National Institute of Standards and Technology in the United States, was used in this study to investigate the smoke control performance in railway tunnels. The flow in the main running line tunnel of the railway, which is the target of this study, exhibits low velocity (Ma < 0.3), and it is assumed to be an incompressible turbulent flow. The momentum equation of Large Eddy Simulation (LES), which implements the effects of turbulent eddies, was used to obtain an accurate solution. Combustion phenomenon modeling for fire implementation used the mixing-controlled combustion model, which shows a fast reaction between fuel and oxygen and is controlled by mixing, and the 1-step simple equation. This model calculates stoichiometric coefficients by specifying components for the chemical formula of fuel, along with the products of carbon monoxide (CO) and soot. It is possible to designate the amounts of generated smoke and CO using the smoke and carbon monoxide as input values for different fire sources. The railway tunnel used in this study had a length, width, and height of 870, 11, and 4.4 m, respectively, and it comprised a single track and a double track. The tunnel had three parts connected to the outside: the tunnel entrance, the main fan and duct, and the tunnel exit. A detailed schematic of the tunnel is shown in Figure 1. In addition, modeling was performed in three regions using three representative areas for sections where the cross-section of the tunnel changed from a single track to a double track. Table 1 lists the detailed sizes of each region.
Jet fans, which are smoke control systems, were positioned at the top of the double track where the railway platform was located, and they could adjust the wind direction. Two jet fans were used, and external air inlets and horizontal openings were installed for the entry and exit of the blown air inside the tunnel. The dimensions of inlet and outlet of jet fan is 2.8 m ├Ś 2.8 m, and the outlet of the fan is exhausted to the outside of the tunnel through the duct. The forward direction of the fan was from the inside of the tunnel to the outside through the duct. Figure 2 shows the schematics of the fan and duct. For the boundary conditions, the tunnel wall was made of concrete, and pressure outlet conditions were applied to the tunnel entrance, tunnel exit, fans, and ducts by reflecting the semiclosed conditions of the tunnel.
A sensitivity analysis was conducted for the grid size to obtain accurate numerical analysis results. The appropriate grid size for the Fire Dynamics Simulator calculations was based on the size of the fire source. The characteristic fire diameter was determined using a grid sensitivity analysis formula (Eq. (1)) presented in the NUREG-1824 report [8].
In Eq. (1), D* is the characteristic fire diameter, and Q ╦Ö D ┬Ę d x
2.2 Experimental procedures
A railway car was used as the fire source to implement a fire in the railway tunnel. The maximum heat release rate of one car was set to 20 MW. For the heat release rate curves, the fire curves of railway cars in the SFPE Handbook of Fire Protection Engineering [10] were used. It was assumed that the car fire started from a seat in the car and expanded to the entire car. The size of the fire source was calculated by designating the entire area of one car. The dimensions of each car was 9.6 m (L) ├Ś 2.4 m (W) ├Ś 1.6 m (H) based on the light rail cars currently produced. The fire source consists of a three cars, and the maximum heat release rate of one, two and three car is 20 MW, 40 MW and 60 MW, respectively. The location was set 100 m from the entrance of the tunnel (region I) to evaluate smoke control performance based on the fire source location. The fire source location and the heat release rate per car are shown in Figure 3. Based on an average flow velocity of 2.5 m/s in the tunnel, the average flow rate per fan was set to 10,200 CMM (170 m3/s). Simulations were performed assuming a constant flow rate. Smoke control capacities of 170 and 150 m3/s were adopted to evaluate safety against the occurrence of a backlayer caused by the smoke control behavior. Detailed experimental conditions are listed in Table 2.
3. Results and Discussion
3.1 Flow rate verification
In this study, the performance of smoke control system was evaluated based on reference velocity of 2.5 m/s used in tunnel design. In addition, assessment of smoke behavior and risk was conducted for flow rate conditions that cause smoke backlayering by varying the flow rate. Based on the basic flow rate of 10,200 CMM (170 m3/s)/fan, the average flow velocity throughout the tunnel was verified. The average flow velocity was obtained by determining the flow rate passing through each cross-section of the tunnel and dividing it by the cross-sectional area. Figure 4 shows the values of the average flow velocity from the entrance of the tunnel to its exit. Although the flow velocity rapidly increased at the main fan where the jet fans were placed, the overall average flow velocity was 2.65 m/s. It is showed that the design flow velocity of 2.5 m/s was exceeded in all regions.
3.2 Smoke behavior in tunnel at reference velocity
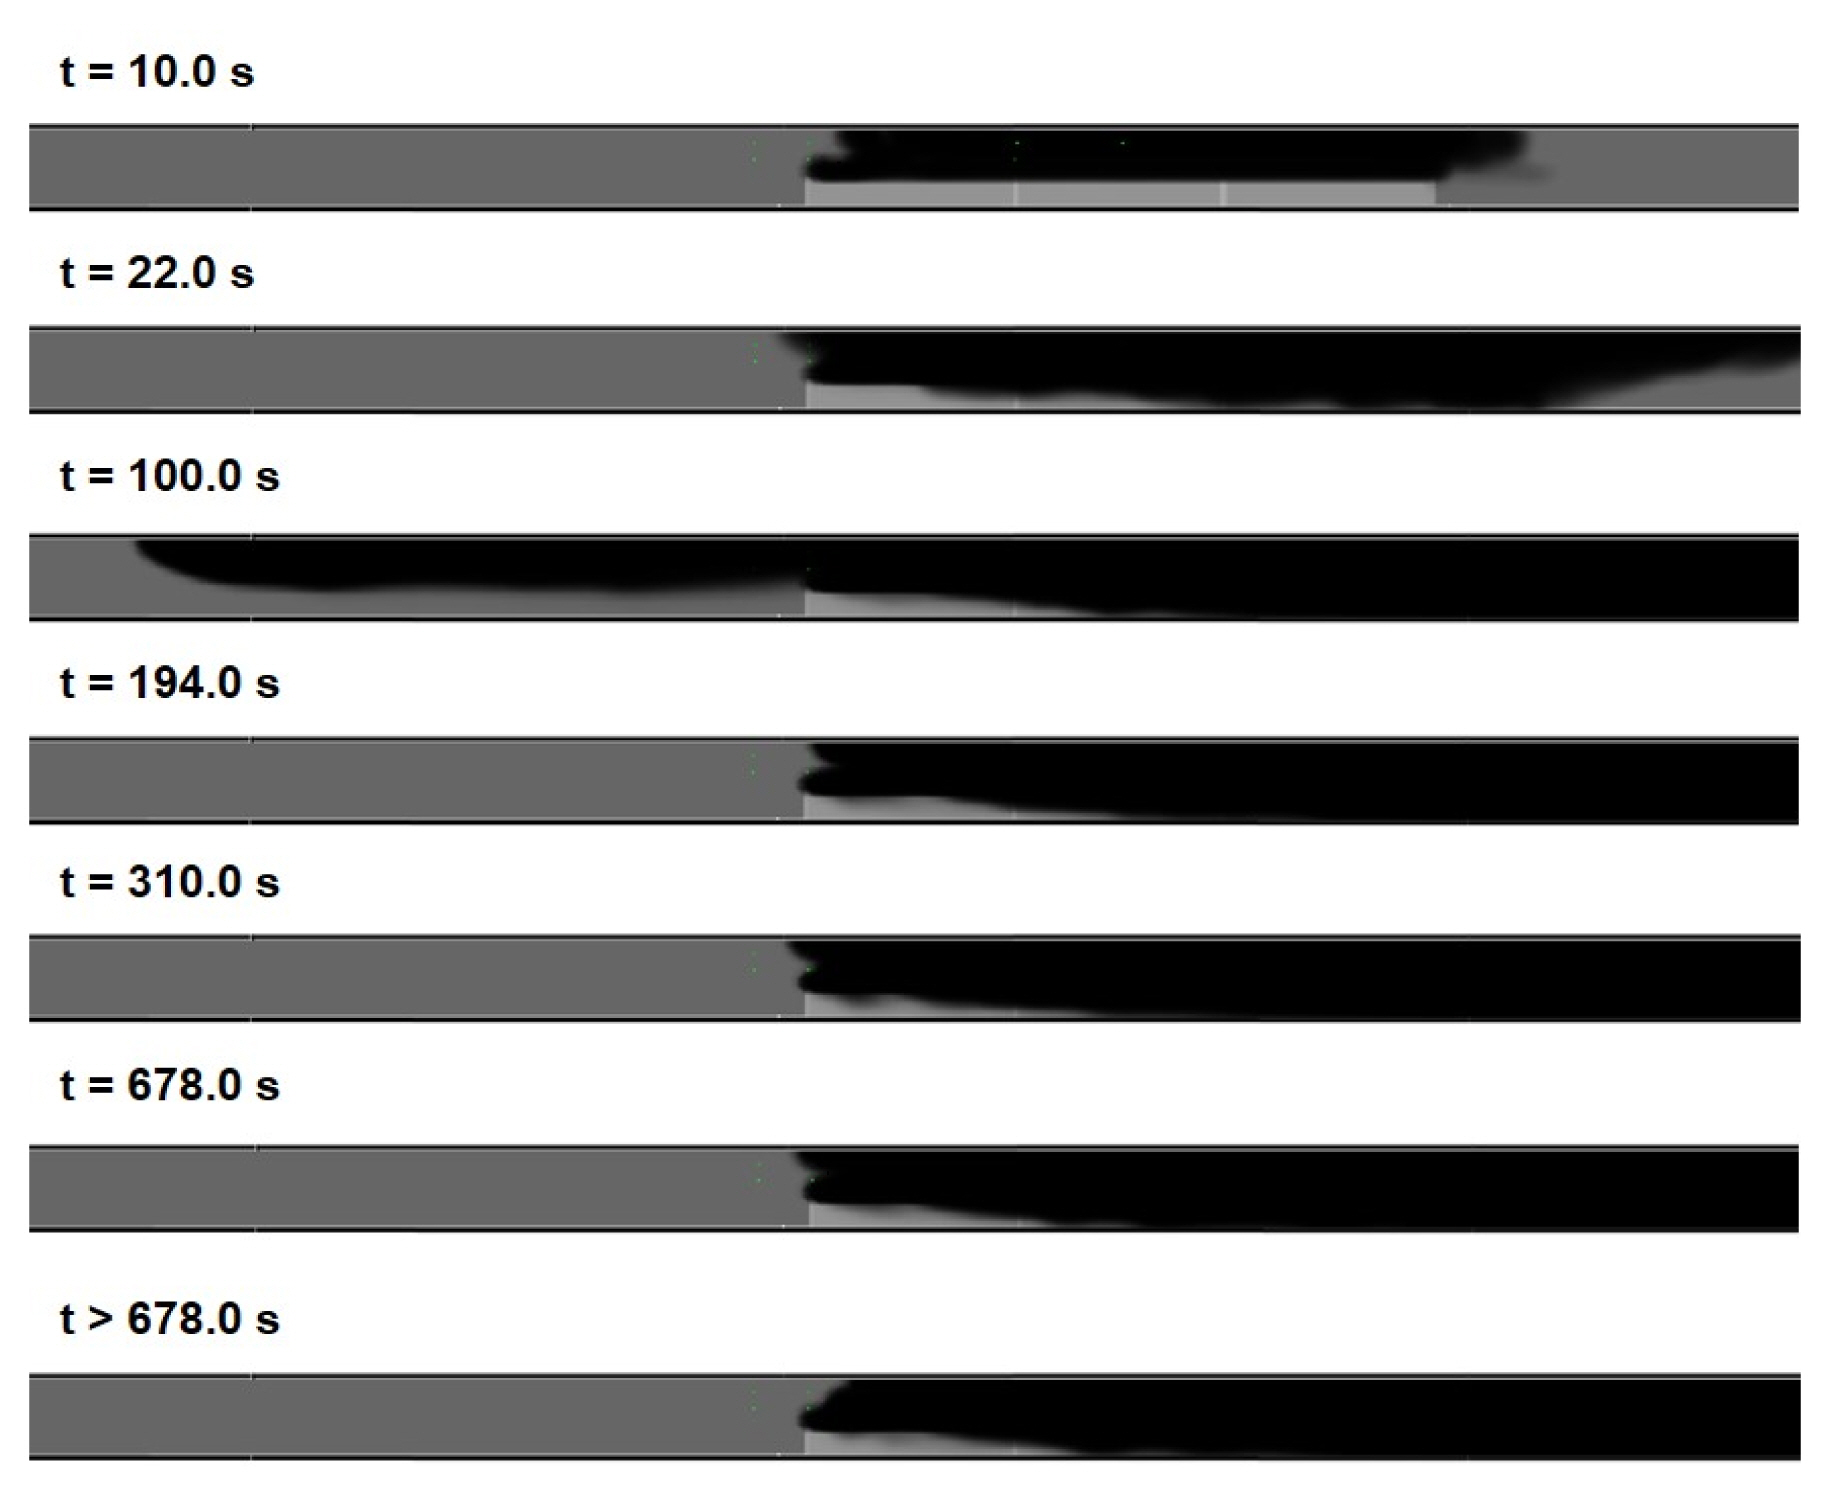
Figures 5-7 show the smoke behavior over time after fire occurrence in the tunnel. The motion of the smoke was expressed by the movement of the soot generated from the fire through flow rate in tunnel. For case A-1, fire scenario for one car, a slight backlayer was observed in direction of tunnel entrance at 54 s. But then, the entire smoke moved in the jet fan direction by supplying sufficient flow rate. Figure 6 shows the results for case A-2. The fire source was two cars, and the heat release rate doubled. In case A-2, the amount of generated smoke was larger than that of case A-1, and the backlayer reached a longer distance than that of case A-1 at 90 s. Although the maximum backlayer occurred at 90 s, the jet fans controlled the smoke with sufficient capacity that could offset the backlayer at 150 s. This phenomenon was also observed in case A-3, as shown in Figure 8. The fire source was increased to three cars, resulting in a considerable backlayer toward the entrance at 100 s. In the case of a fire in three cars, evacuees may be momentarily exposed to smoke at the beginning due to the occurrence of the backlayer in the evacuation route direction. It was found that the maximum backlayer occured at 100 s and gradually disappeared by a smoke control.
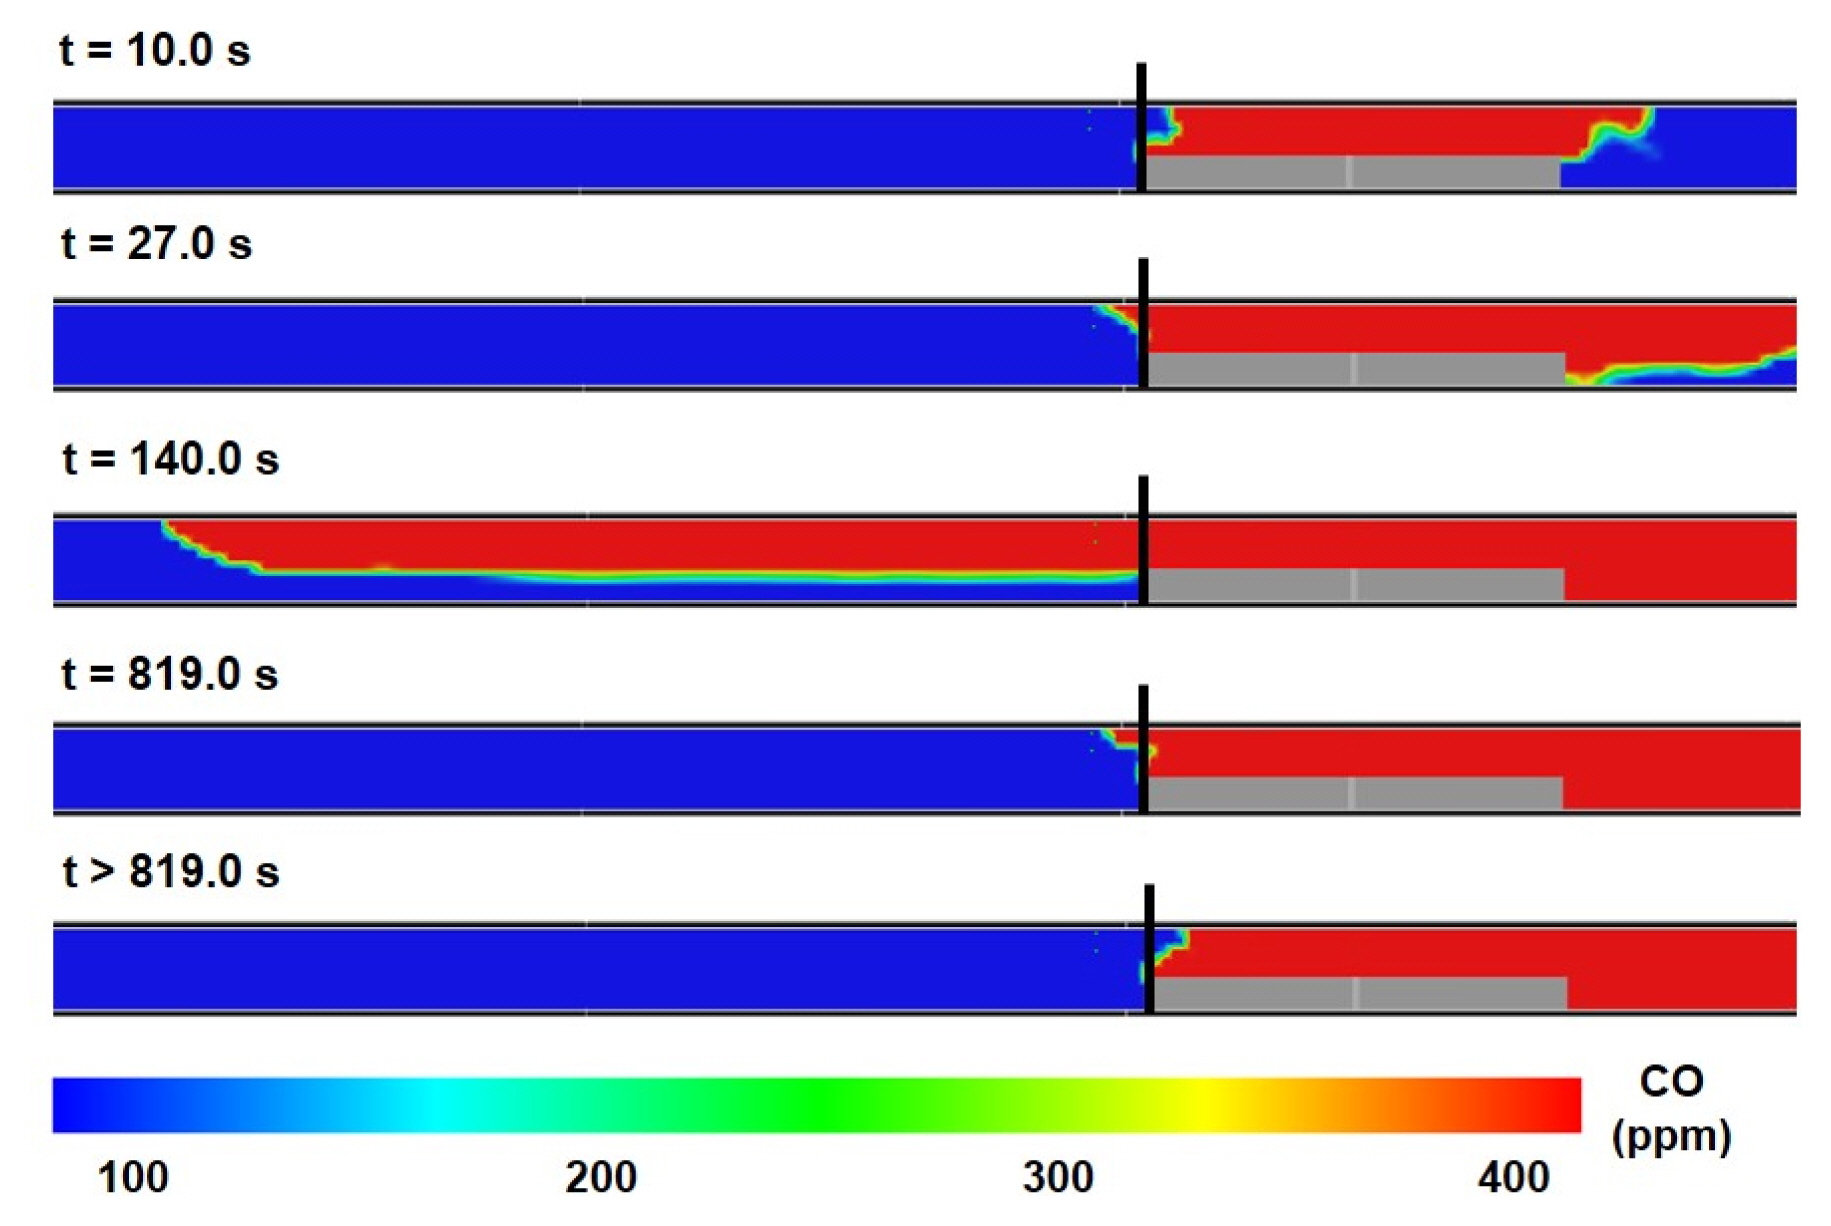
The calculation of the critical velocity required to prevent the backlayer can be determined from the CO gas behavior. When a CO concentration of 100 ppm or higher exists in the upstream area at the front end of the fired car, the backlayer phenomenon occurs [11]. Figures 8, 9, and 10 show the contours of CO concentration in smoke in cases A-1, A-2, and A-3, respectively. The legend was expressed from 100 to 400 ppm, and the front end of the car was marked with a line. The backlayer was clearly expressed through the CO concentration. In case A-2, the backlayer developed from the entrance to 80 m at 84 s. In case A-3, the longest backlayer was generated at 100 s and decreased gradually. From 310 to 678 s, the backlayer only appeared in the fire source region and disappeared.
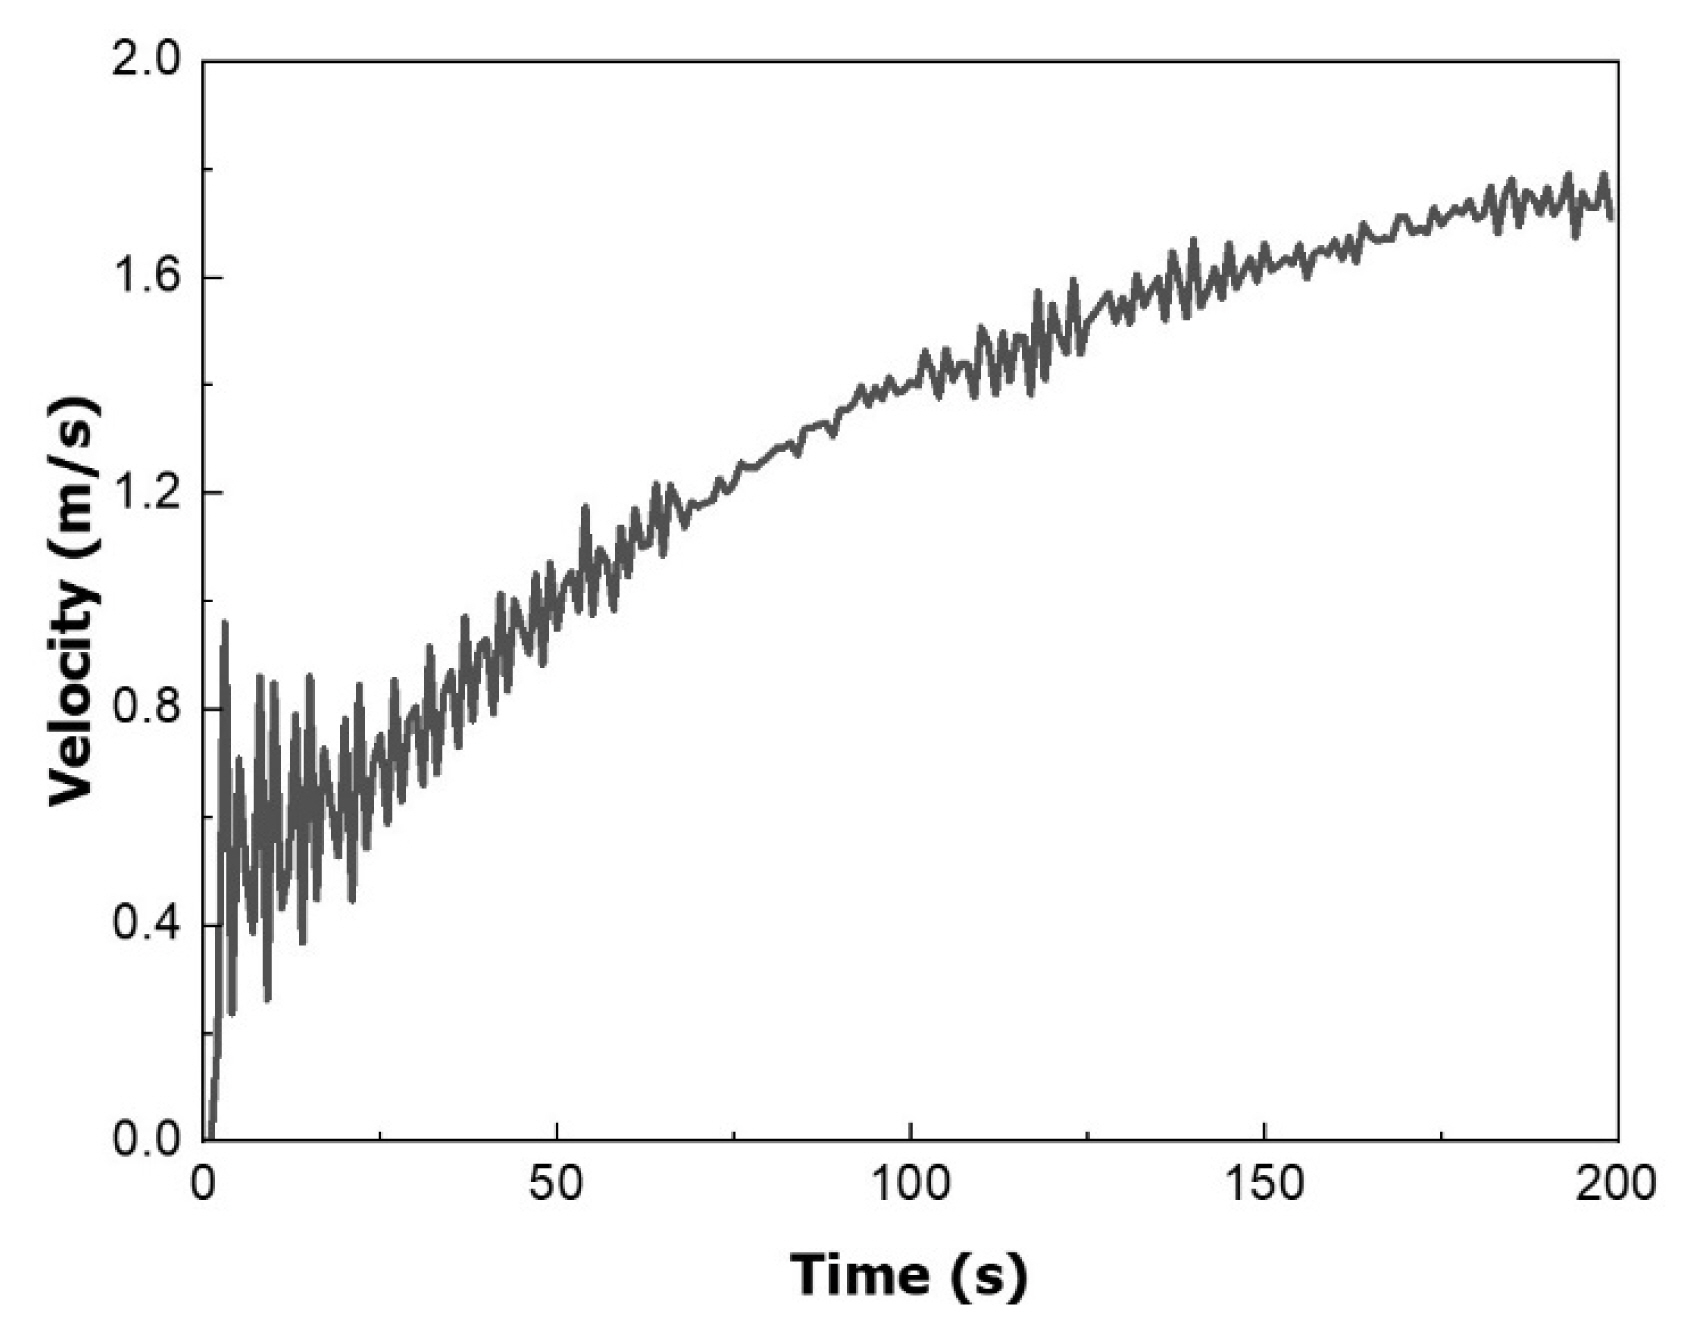
For all conditions, the backlayer formed temporarily, and the entire smoke flowed in the fan direction after a period. This result shows the delay effect for the smoke control of the jet fans. No ramp was applied to the jet fans used in this study to increase the maximum flow rate. Nevertheless, this delay occurred because the tunnel was long, and it took considerable time to reach the average design velocity near the fire source. Figure 11 shows the velocity distribution over time near the fire source. The flow velocity increased until 200 s. Therefore, since the amount of smoke generated is temporarily larger than the flow rate of smoke control sytem within 200 s, the backlayer of smoke may appear. This may occur depending on the location of jet fans in a long tunnel. This phenomenon occurred in this study because of the considerable distance between tunnel entrance and jet fan. It can be overcome by installing additional fans between the entrance and the main fans.
3.3 Smoke behavior in tunnel at low flow rate
At the reference velocity, the temporary backlayer formed but disappeared when a sufficient flow velocity approached the fire source. The smoke control performance was evaluated at a lower flow rate than the reference velocity. Figures 12-14 show the CO concentration according to the fire source size over time for the backlayer analysis. For all simulation conditions, the length of the backlayer increased as the average flow velocity decreased. Although the time at which the backlayer occurred increased with the size of the fire source under the reference velocity condition, the backlayer occurred at a similar time regardless of the fire source size under the low flow rate condition. This is because the flow velocity capable of controlling the backlayer could not be developed to the fire source while the amount of generated smoke was fully developed. Under the reference velocity condition, the time at which the backlayer formed increased as the size of the fire source increased, and the maximum backlayer occurred at 100 s. However, under the low flow rate condition, the backlayer occurred under all conditions because it took more time to develop the flow velocity that could block the backlayer. Moreover, the length of the backlayer significantly increased as the size of the fire source increased.
Since the long backlayer occured in low flow rate condition than that for reference rate condition, it is difficult to secure the evacuation route in fire. However, when a sufficient flow velocity was developed by the main fans, no backlayer appeared. Therefore, sufficient smoke control is possible, even at velocity conditions lower than the reference velocity, despite the formed backlayer. This indicates that it is essential to select the location of smoke control fans such that sufficient flow velocity can be developed throughout the tunnel without delay in the early stage of fire than the reference velocity condition for a long tunnel.
4. Conclusion
In this study, the appropriateness of an average flow velocity of 2.5 m/s, which is used for smoke control system design in railway tunnels because of the absence of specific standards, was evaluated. Fire scenarios for one, two, and three light rail cars were simulated to evaluate the smoke control performance based on the size of the fire source at an average flow velocity of 2.5 m/s. The target tunnel was 872 m long with a complex structure consisting of a single track and double track. The location of the fire source was set to 100 m from the tunnel entrance. Based on the results of this study, the following conclusions are drawn.
At an average flow velocity of 2.5 m/s, a backlayer appeared within 2 min after the fire occurrence. The length of the backlayer increased as the size of the fire source increased. However, the backlayer disappeared when a sufficient flow velocity approached the fire source. Under the low-smoke control performance condition, the backlayer disappeared when sufficient flow velocity was generated although it was formed at 140 s regardless of the size of the fire source owing to the delay in generating sufficient flow velocity for smoke control.
Because it takes time to form the average flow velocity for a long tunnel, the time required to generate flow velocity is more important than the influence of capacity. In addition, sufficient smoke control performance is achieved at the reference velocity, but the risk of the backlayer continues until an appropriate flow velocity is formed.