1. Introduction
As buildings become more diverse, larger, and taller, the casualties and property losses due to fires has increased. This led to the need for minimizing damage during fires with immediate fire suppression. Sprinklers are known as an important tool for early fire suppression and damage minimization.
A fire sprinkler is a hydraulic extinguishing device that sprays water to cool combustible materials in case of a fire. The main factors that influence spray behavior and fire suppression performance are droplet size, velocity, and droplet number density [
1]. Larger droplets are favorable for effectively reaching and cooling burning surfaces, as they can penetrate flames. Smaller droplets have the possibility of evaporating before reaching the burning zone. However, large droplets are difficult to vaporize while absorbing heat. Small droplets with high speed possess high momentum, enabling both penetration and vaporization to occur simultaneously. Therefore, the ability to sufficiently cool flames to a non-sustainable temperature depends on factors such as droplet size, velocity, and droplet number density [
2]. As a preliminary study on the cooling efficiency of sprinklers, many investigations have been carried out to measure the physical characteristics of droplets from fire sprinklers. Widmann et al. [
3] studied the effects of operating pressure on droplet size using sprinklers with varying K-factors. Zhou et al. [
4] compared droplet size and velocity of sprinklers in both near and far fields at different pressures using a pendant sprinkler with a K-factor of 162 LPM/(MPa) 0.5. The distance from the sprinkler and structural components influenced the droplet size and velocity. Zhou et al. [
5] found discovered that droplet properties vary depending on the measurement direction from the frame arm. These studies highlight that the physical properties of droplets from sprinklers depend on supplying pressure, measurement direction, and location. Min et al. [
6] measured the droplet size from flush and pendant sprinklers with various K-factors. However, there was a lack of empirical data measuring droplet size and velocity distribution for an upright sprinkler with a K-factor of 80.
This study aims to measure the droplet size and velocity from an upright sprinkler with a K-factor of 80 at various measurement locations. Droplet images were used to measure droplet size and velocity in order to investigate the relationship between droplet size and velocity.
2. Method
2.1 Experimental setup
A sprinkler head with a K-factor of 80 was utilized and centrally positioned between two acrylic partitions. Information regarding the sprinkler used in this study is summarized in
Table 1. Clear droplet images were obtained with a light source positioned behind the spray. A high-speed camera with a resolution of 1024 ├Ś 1024 pixels was employed to capture images at a rate of 4000 fps. The size of field of view was set to 62 ├Ś 62 mm
2. mm┬▓, with one pixel corresponding to 0.06 mm. Therefore, the minimum droplet diameter that could be measured with this setup is 0.06 mm. The camera's measurement location is detailed in
Table 2, and
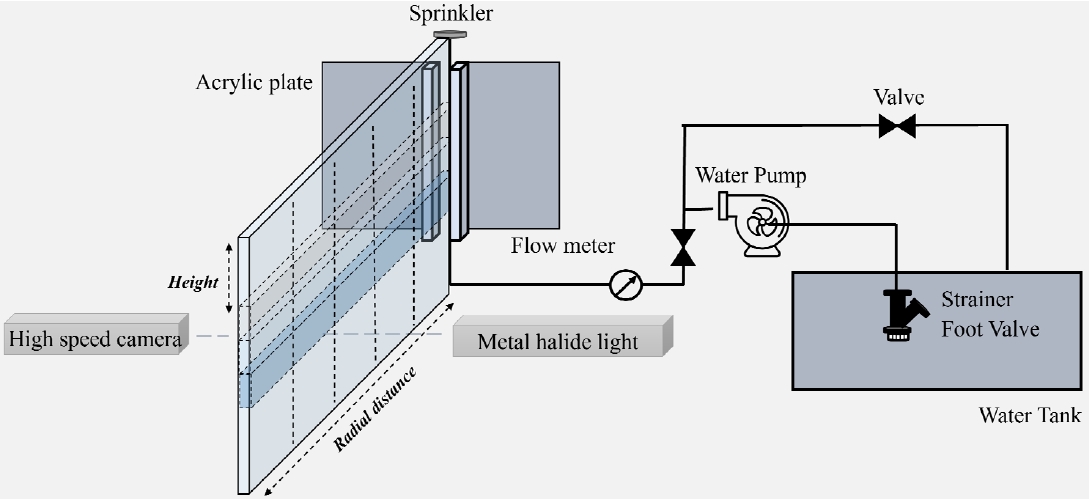
Figure 1 illustrates a comprehensive layout of the experimental setup. Water was drawn into the tank through a foot valve and supplied to the sprinkler at a constant flow rate via a pump. A flow meter was installed just before the sprinkler head to verify the flow rate. To control the flow, a channel leading back to the tank from the discharge side was added.
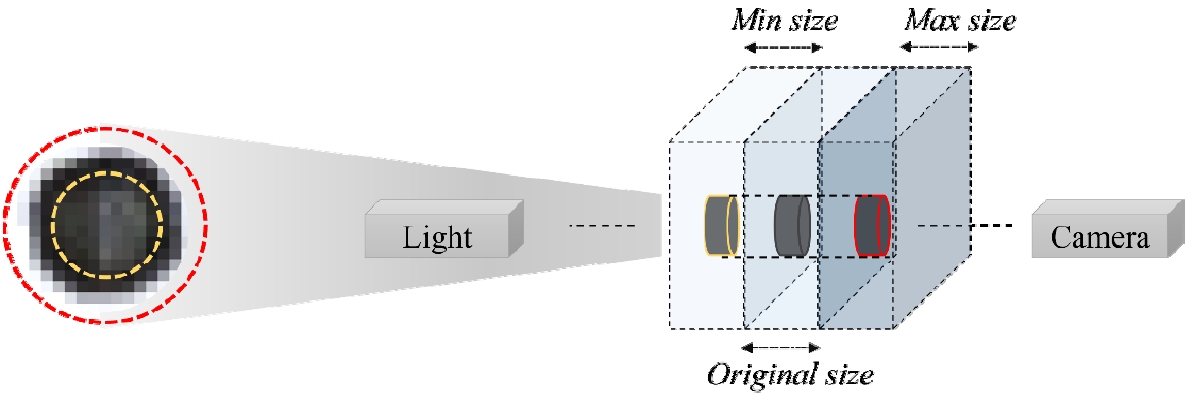
Figure 2 provides a simulated representation of the process for capturing the size and velocity of liquid droplets ejected from the sprinkler using a high-speed camera. Due to the 3 cm gap between the acrylic partitions, similarly sized droplets were captured by the camera but appeared different in size. Droplets closer to the camera appeared larger than their actual size, while those farther away were measured as smaller than their true size. This results in a measurement error of approximately 5.22%.
2.2 Data analysis
Data analysis and image processing were conducted using MATLAB 2023a. The image processing steps are detailed in
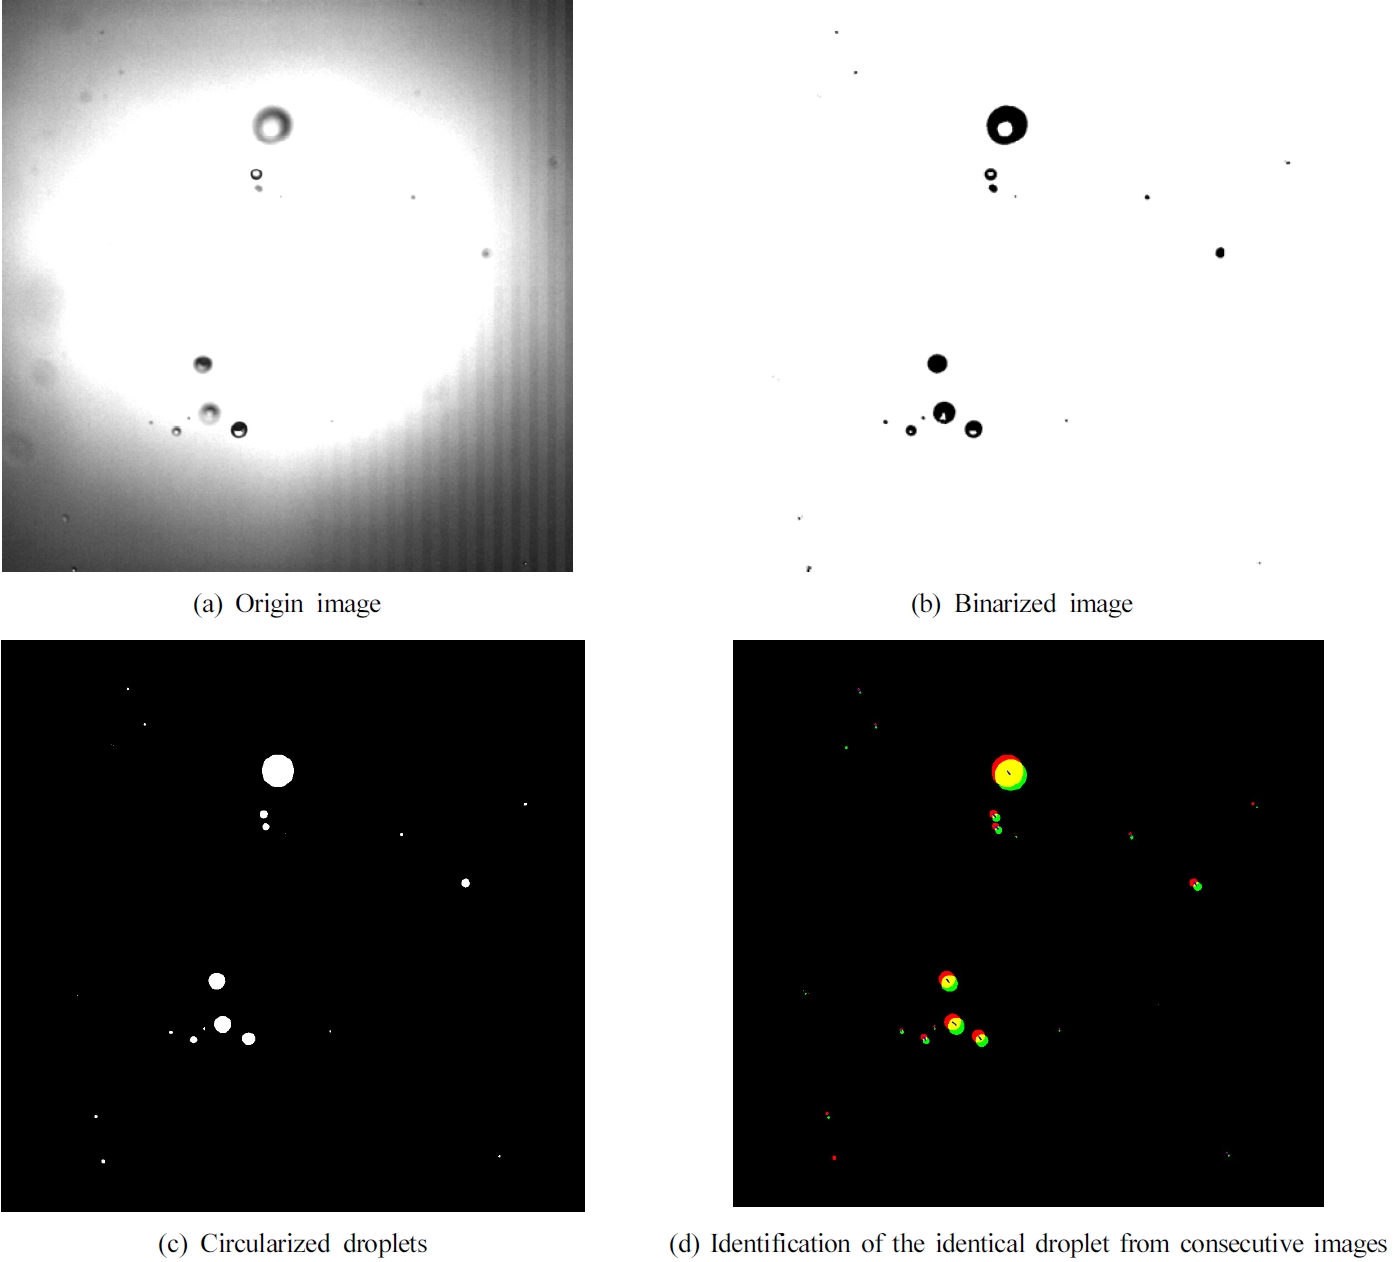
Figure 3. Droplet images were obtained at each designated position (
Table 2) while considering the droplet path (
Figure 3(a)). During this procedure, a total of 270 paired images were acquired at each position, with a few exceptions where no droplets were present. The background captured by the light source was removed. This was achieved by calculating the average of all original images taken at the same location and subtracting this average image from each original image. The filtered droplets were then highlighted against a black background, emphasizing the edges of the particles. This process aimed to retain only those particles closer to the focal plane. The next step involved applying an appropriate threshold to filter out distant droplets [
7]. Based on this threshold, the image was converted into a binary format with a white background and black edges (
Figure 3(b)). In this study, a threshold pixel intensity value of 30 provided optimal results. Internal voids created by light transmission were filled in black. The droplet was subsequently transformed into a circular shape, using the mean value of its major and minor axes to determine its diameter (
Figure 3(c)). This methodology facilitated the computation of the droplet's diameter. Droplet velocity was determined by calculating the centroid of the droplet over two successive images and dividing it by the time interval between captures. The initial image's droplet, outlined in red, was superimposed onto the subsequent image's droplet, depicted in yellow. A blue line connected their central points, illustrating their trajectory (
Figure 3(d)). To assess the velocity of droplets, two consecutive images were used. If no matching droplets were found in the consecutive images, they were labeled as 'NaN' (Not a Number).
3. Results and Discussion
3.1 Droplet size distribution
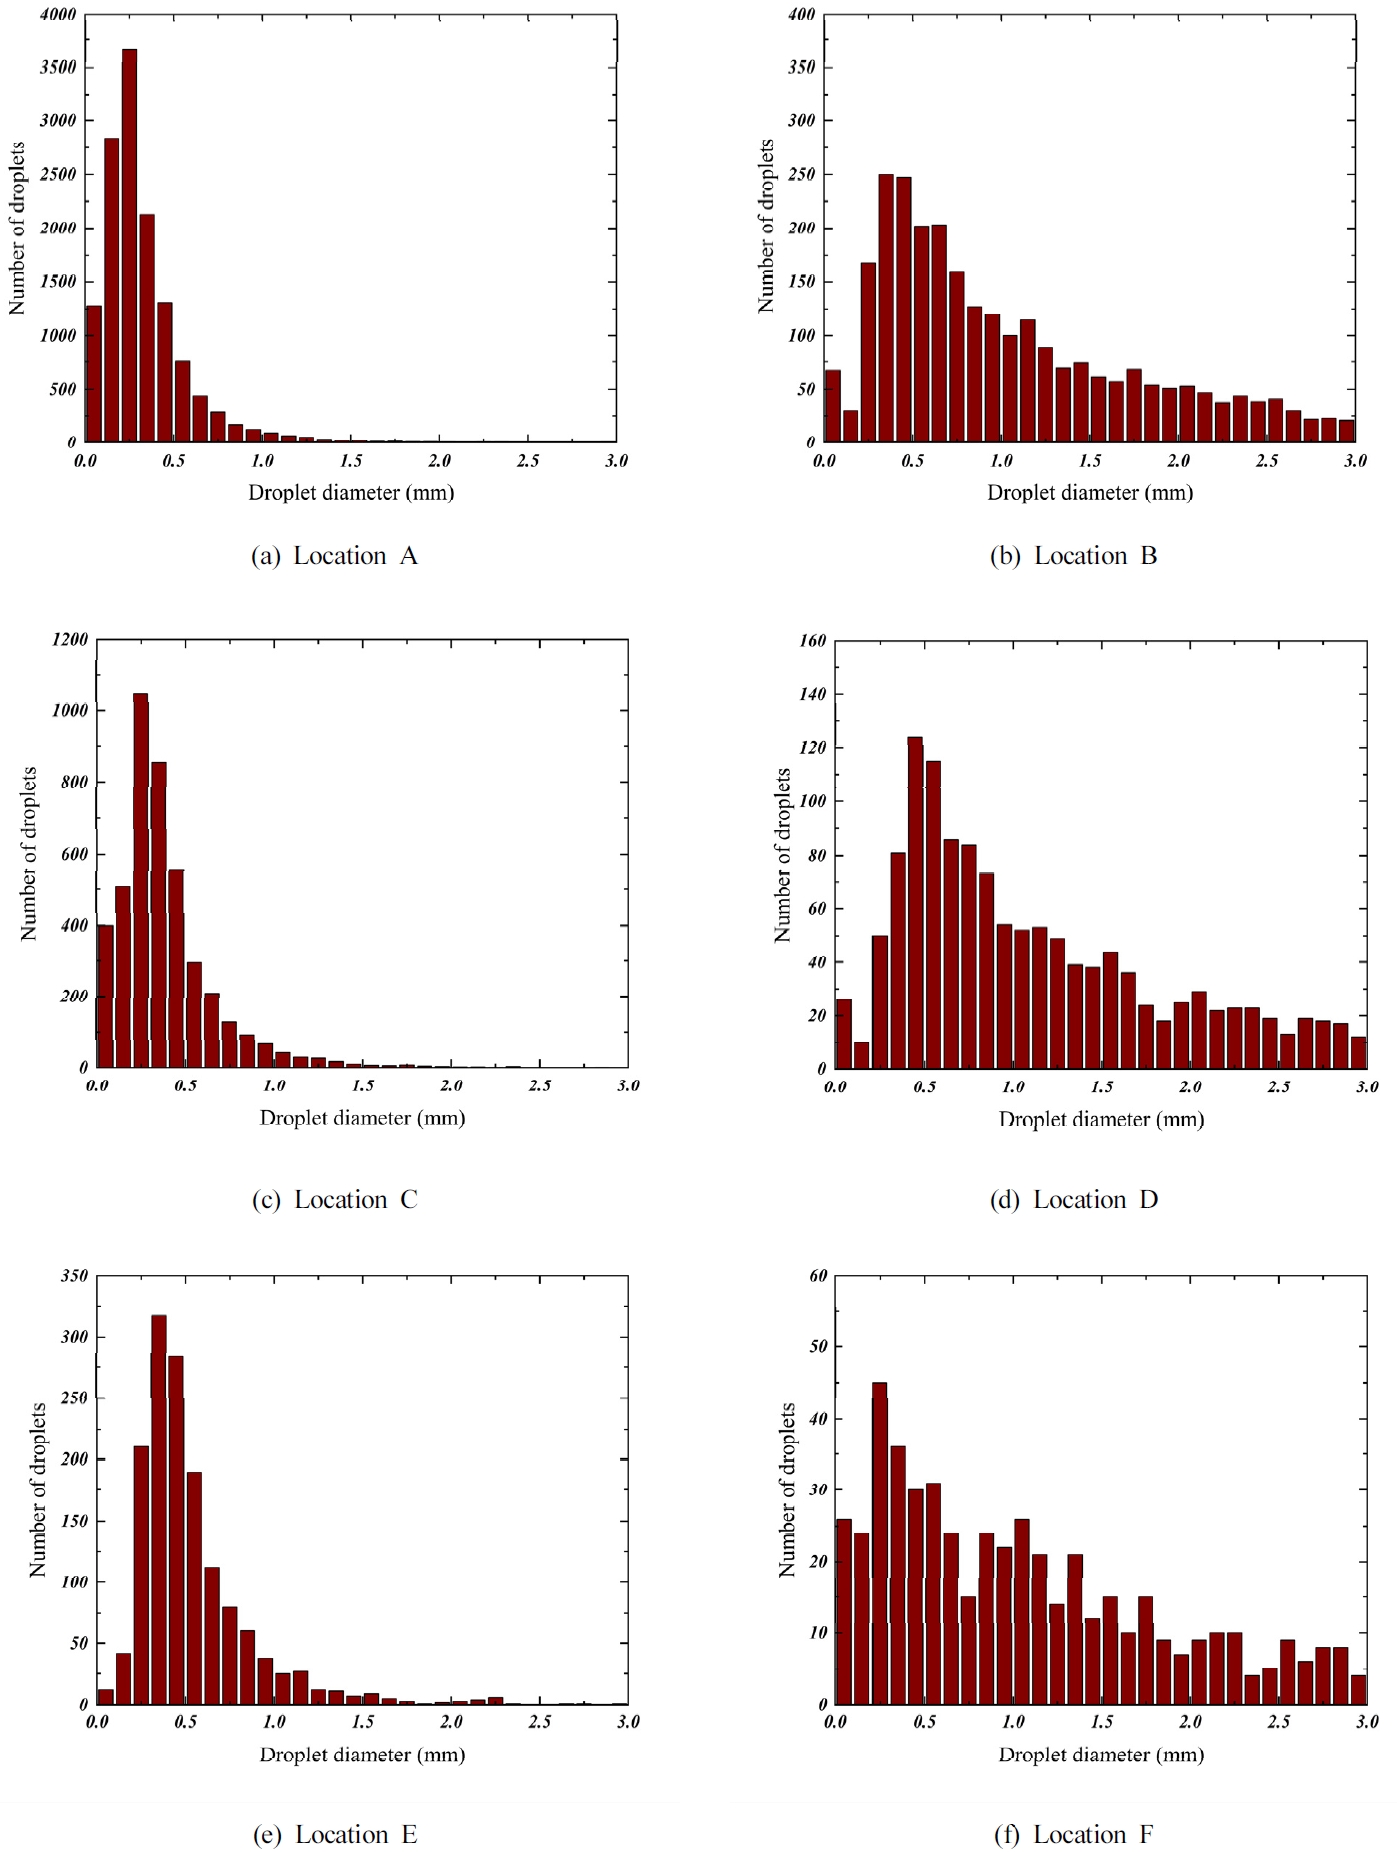
The count of droplets measured based on droplet diameter interval of 0.01 m at fixed measurement location is shown in
Figure 4. Notably, droplets with diameters less than 0.1 mm were observed predominantly in the proximal regions at a distance of approximately 0.3 m from the sprinkler head. In contrast, in regions beyond 0.9 m, droplets less than 0.5 mm were observed. A narrorw droplet size distribution was observed near the sprinkler head, whereas a wider droplet size distribution was observed at far region in radial direction.
The average droplet size used in sprinkler spray analysis can be represented in various ways, depending on the method of statistical processing. However, the volume median diameter (Dv50) is widely employed as a representative droplet size. To investigate droplet sizes, both the droplet count and Dv50 values were calculated based on the location and are presented in
Table 3. In this study, 270 pairs of images were captured at each measurement location. In these images, the number of detected droplets varied at each measurement position. The droplet count per image ranged from a minimum of 549 to a maximum of 13,335, depending on the position. This variation is due to differences in water flux density at each specific measurement location. A dense spray is formed near the sprinkler head, resulting in a large number of captured droplets, whereas a sparse spray is formed at locations farther from the sprinkler head. Despite this disparity in the number of droplets at different measurement locations, the count was sufficiently large to provide reliable results, and there were no issues in comparing physical quantities for each measurement location [
4,
5]. Even though the number of images was the same for each measurement location, the number of droplets counted at a vertical distance of 0.3 m was ten times the number of droplets counted at a vertical distance of 0.6 m at the same radial distance. Droplets of approximately 1 mm were observed at the measurement location close to the sprinkler head in the radial direction. In contrast, larger droplets, approximately 4 mm in diameter, were distributed at the measurement location farther from the sprinkler head in the radial direction. It was found that Dv50 increased as the vertical distance increased while maintaining the same radial distance, in the order of measurement locations A, C, and E
3.2 Droplet velocity
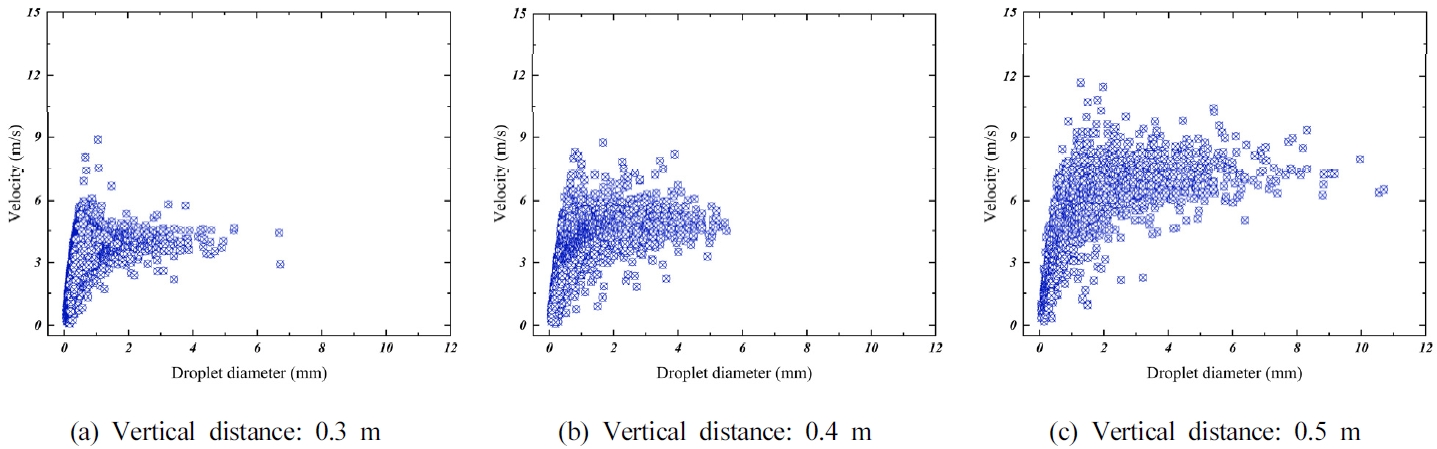
Droplet velocities measured at various vertical distances are presented in
Figure 5. The measured data was plotted on the graph by sweeping a radial distance at a given vertical distance. Generally, larger droplets exhibit greater velocities. This phenomenon can be attributed to the quicker momentum loss experienced by smaller droplets compared to larger ones. Furthermore, the correlation between droplet size and velocity is influenced by the distance they travel from the deflector, primarily due to the impact of air drag forces [
4].
3.3 Droplet momentum
The momentum depending on the droplet diamter was presented for various measurement location in the same way as shown in
Figure 5. Momentum is by
Eq. (1) as follows:
Here, Pd r, Žü, and v are the droplet momentum, radius, liquid density, and droplet velocity, respectively.
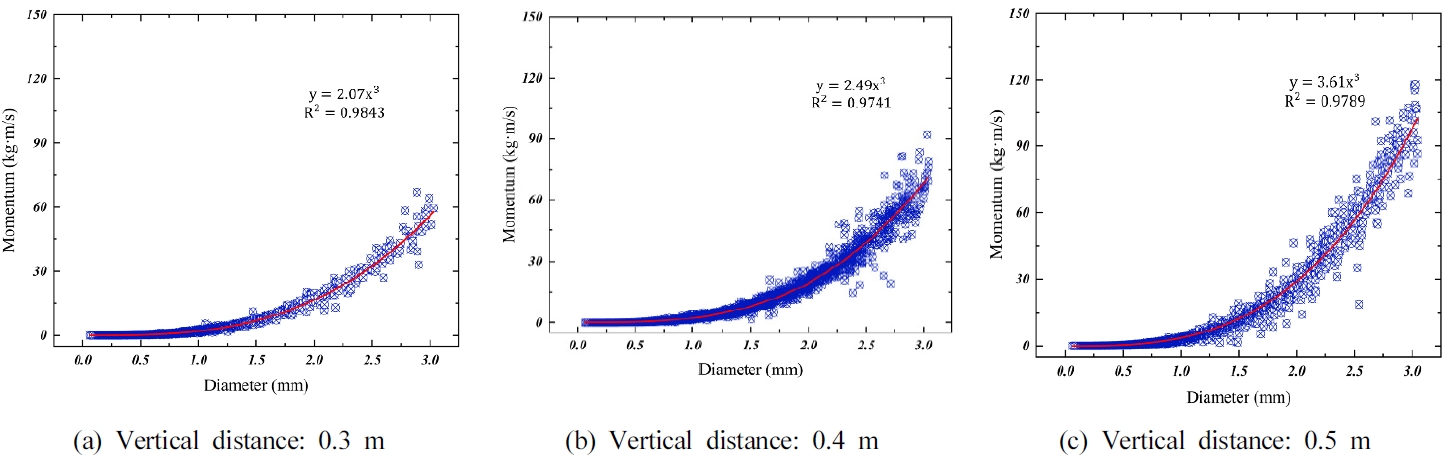
The momentum depending on the droplet diameter for vairous vertical distances are depicted in
Figure 6. Equations predicting droplet momentum with droplet diamter has been derived through regression analaysis. Although the small droplets with high velocity exists in the sprinkler spray (
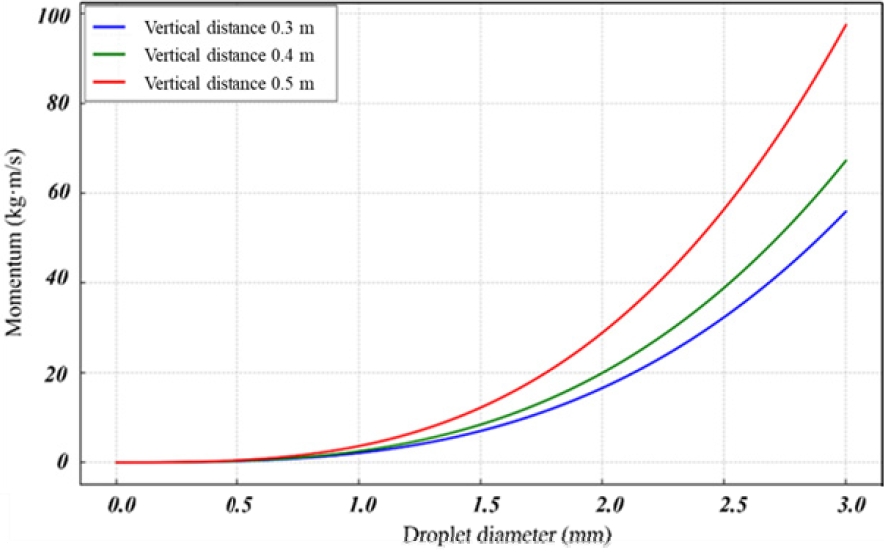
Figure 5), the momentum increases with the droplet size. The trend line at three vertical distance given in
Figure 6 is shown in
Figure 7. The overall droplet momentum increased regardless of droplet diameter as the vertical distance increased. The can attributed to the fact that the gravitational force acts on the all sizes of droplets.
4. Conclusion
In this study, droplets from an upright sprinkler head with a K-factor of 80 were captured using a high-speed camera. Two consecutive images taken at positions measured at various vertical and radial distances from the sprinkler head were used to measure the diameter and velocity of the droplets. Several key observations can be summarized as follows:
1. The number of droplets at each location decreased as both radial and vertical distances increased. Small droplets were observed in the region with a short radial distance, while large droplets were observed in the region with a large radial distance.
2. The droplet velocity increased as the vertical distance increased, primarily due to the influence of gravity. Additionally, the larger the diameter of the droplet, the faster its speed.
3. The droplet momentum value was calculated using the diameter and velocity of the droplet. At all vertical distances, larger droplets had greater momentum values, mainly because they had higher velocity values. The momentum value also increased as the vertical distance increased due to the influence of gravity.